 HeyPlanly
How to Set Up an Annual Budget for 2027 in Google Sheets (12 Months on One Dashboard)
An annual budget is not twelve monthly budgets stapled together. It is one grid, twelve columns, one log of transactions for the whole year, and a handful of SUMIFS that turn the log into a month-by-month picture. Set it up once in December and 2027 runs on the same file. Here is the structure, with the numbers from the template's sample year (nine months of 2026 logged).
Step 1: the plan, twelve columns wide
The sample plans 4,850 of income a month (4,200 salary, 350 side income, 300 freelance) and 4,200 of expenses across 17 categories, the same every month except December, where Gifts goes from 50 to 300. That is 50,650 planned for the year and 650 a month left over on paper.
| Category | Planned / month | Actual, avg of 9 months | Diff / month |
|---|---|---|---|
| Housing | 1,400 | 1,400.00 | 0.00 |
| Groceries | 550 | 507.91 | 42.09 |
| Savings | 500 | 400.00 | 100.00 |
| Transportation | 320 | 344.69 | -24.69 |
| Debt payments | 330 | 304.44 | 25.56 |
| Utilities | 220 | 214.73 | 5.27 |
| Dining out | 180 | 78.37 | 101.63 |
| Insurance | 160 | 130.00 | 30.00 |
| Subscriptions | 45 | 17.10 | 27.90 |
| Health | 80 | 35.00 | 45.00 |
| Clothing, Personal care, Other | 235 | 19.68 | 215.32 |
| Kids, Pets, Entertainment, Gifts | 180 | 0.00 | 180.00 |
| Total expenses | 4,200 | 3,451.93 | 748.07 |
Two things a year-wide view shows that a single month cannot. Transportation is the only line over plan, and only by 25 a month: the car payment is 320 on its own, so the 320 plan never covered fuel. And 415 a month of plan (the last two rows) is spread over seven categories that barely get used. That is not a spending problem, it is a planning one: the money was never going to be spent there, so the 650 a month "left over" on paper understates it. The actual average is 820 a month, and that is with income averaging 4,272 instead of the 4,850 planned.
Step 2: one log, with a Month column
Every paycheck and every purchase goes into one Transactions tab: date, type (Income or Expense), category from a dropdown, description, amount. The sample has 145 rows for January to September. The column that makes the annual grid possible is Month, computed from the date, so nothing has to be typed twice:
G6:  =IF(B6="","",MONTH(B6))          ← B is the date
H6:  =IF(B6="","",YEAR(B6))
Then each cell of the Actual block is one SUMIFS: amount, where month = this column, type = Expense, category = this row.
=SUMIFS(Transactions!$F$6:$F$1005,
        Transactions!$G$6:$G$1005, 1,            ← 1 = January; 2 in the next column
        Transactions!$C$6:$C$1005, "Expense",
        Transactions!$D$6:$D$1005, $B51)         ← category name in column B
Seventeen categories × 12 months = 204 copies of that formula, and the grid fills itself for the rest of the year. Income works the same way with "Income" as the type. The Full version of the template adds bills you tick Paid on their own tab and an Auto category column driven by keyword rules (any description containing "Kroger" becomes Groceries), so pasting a bank export needs no retyping.
Step 3: the year on one screen
The Annual Overview is twelve rows: income and expenses pulled from the grid totals, left over, savings rate, cumulative left over, planned expenses and under / over. Here is the sample year through September:
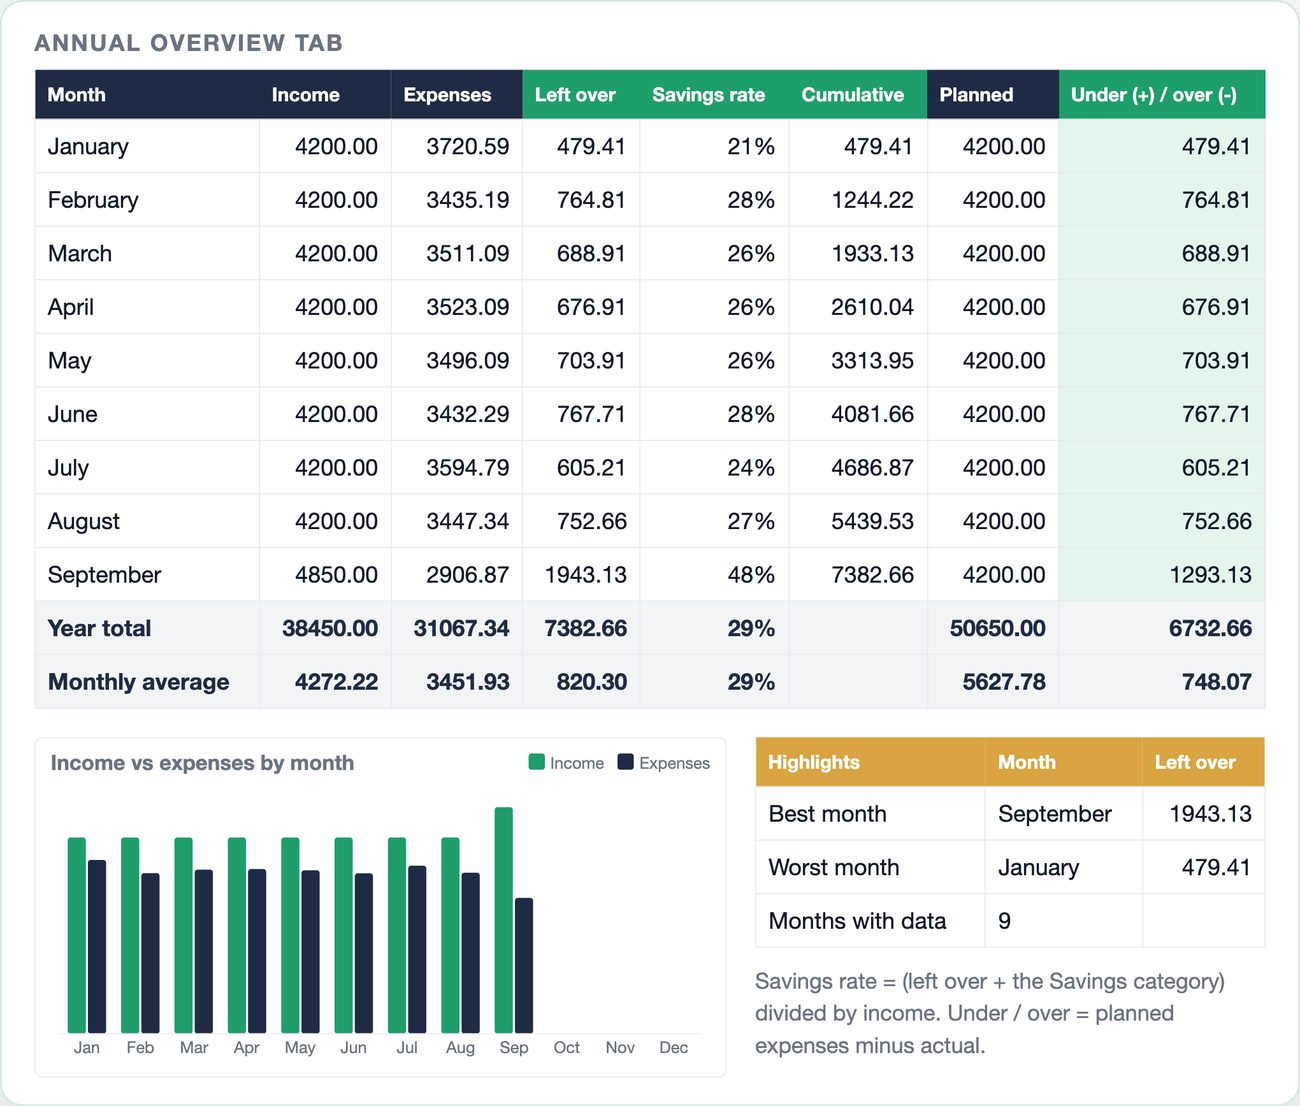
Savings rate counts what was left over plus what was deliberately moved to savings, divided by income. For January: (479.41 + 400) / 4,200 = 21%.
=(E6 + SUMIF('Monthly Budget'!$B$51:$B$72, "Savings", 'Monthly Budget'!C51:C72)) / C6
Best and worst month are an INDEX / MATCH on the Left over column, and the monthly average divides by months with data rather than by 12, so a September average is not dragged down by three empty months:
Best month:  =INDEX(B6:B17, MATCH(MAX(E6:E17), E6:E17, 0))
Average:     =E18 / COUNTIF($C$6:$C$17, ">0")
The best-month trap
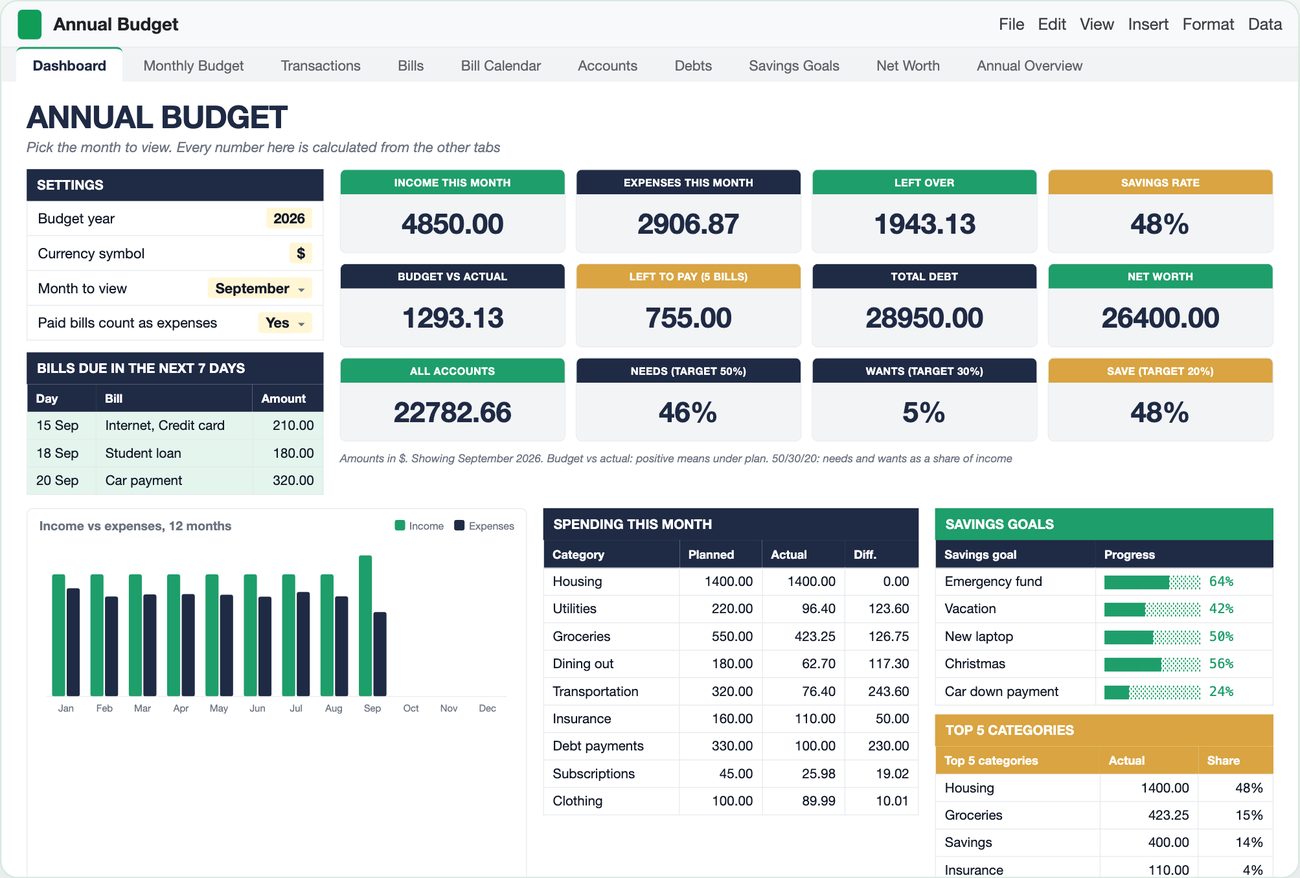
The overview says September is the best month: 4,850 income, 2,906.87 expenses, 1,943.13 left, a 48% savings rate. It is also the only month where the side income and the freelance project actually arrived (350 + 300 on top of the 4,200 salary; the plan expected them every month). And it is not over. The bills still due after the 20th are internet 60, credit card minimum 150, student loan 180, car payment 320 and phone 45, which the dashboard shows as "left to pay: 755".
| September | As logged (Sep 20) | With the 5 bills paid |
|---|---|---|
| Income | 4,850.00 | 4,850.00 |
| Expenses | 2,906.87 | 3,661.87 |
| Left over | 1,943.13 | 1,188.13 |
| Savings rate | 48% | 33% |
33% is still the best month, but for the right reason (650 of extra income), not because the month was cut short. Two habits fix this: compare finished months only, and keep a "left to pay" number on the dashboard so a half-logged month never looks like a win.
Step 4: the stock, not just the flow
A budget measures flow: money in minus money out. It does not tell you whether you are richer than in January. For that, one more tab with two short lists (assets, liabilities) and a twelve-row log you fill in on the last day of each month.
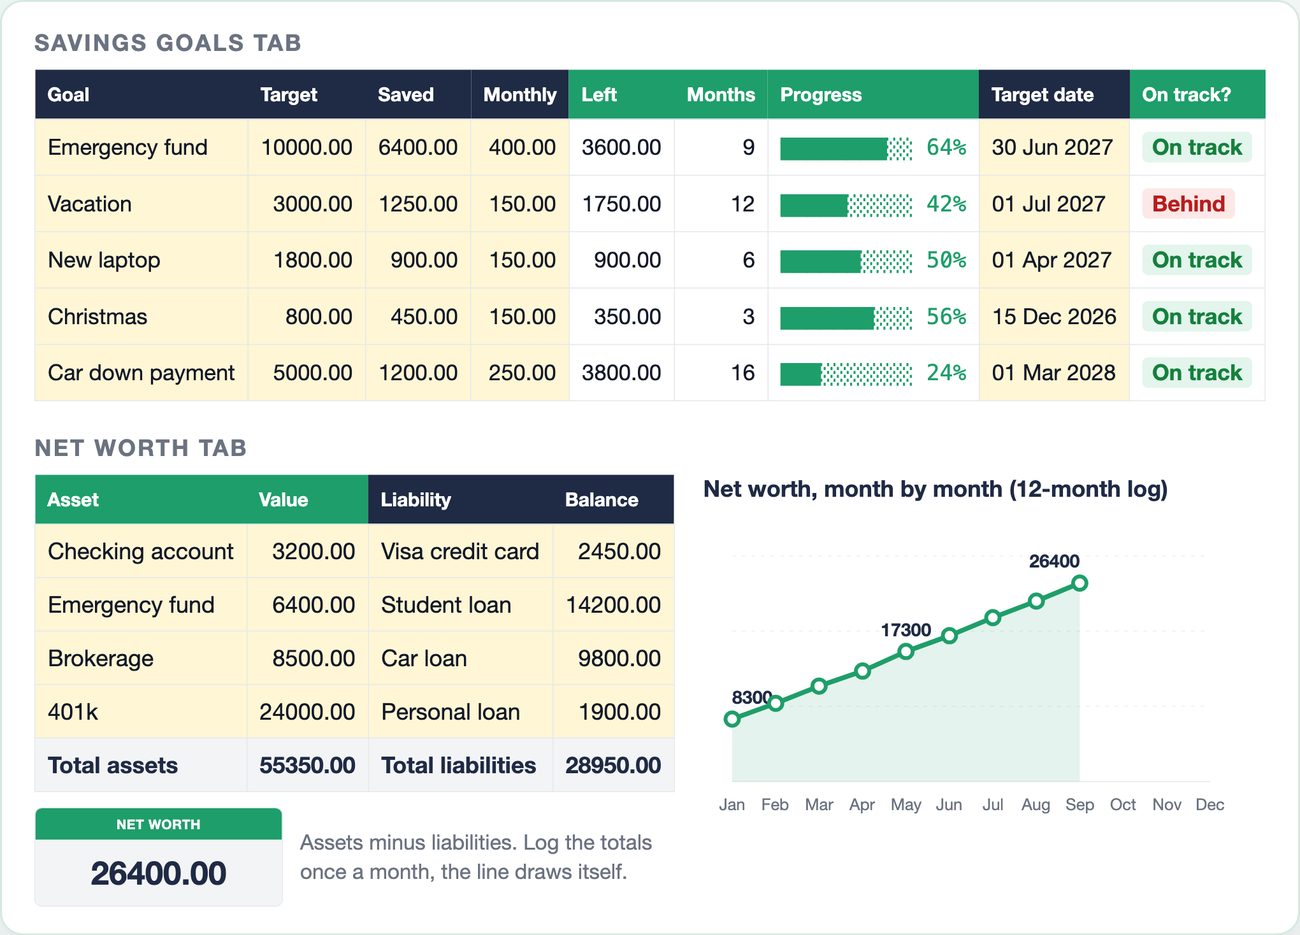
In the sample, assets are 55,350 (checking 3,200, emergency fund 6,400, vacation fund 1,250, brokerage 8,500, 401k 24,000, car 12,000) and liabilities 28,950 (credit card 2,450, student loan 14,200, car loan 9,800, personal loan 1,900, medical bill 600). Net worth 26,400, up from 8,300 in January: +18,100 in eight months, roughly 2,000 to 2,600 a month, while the budget only left 7,382.66 over. The gap is the retirement account and the loan principal going down, which a budget never sees. The log is two typed numbers a month and a subtraction:
Net worth:  =C23-D23
Change:     =F23-F22
The savings goals tab uses the same idea in reverse: months to go = what is left divided by the monthly amount, rounded up, compared with the target date. The vacation fund (1,750 left at 150 a month = 12 months) misses its July 2027 date, so it is flagged Behind; the emergency fund (3,600 left at 400 = 9 months, due June 2027) is on track.
=ROUNDUP((C6-D6)/E6, 0)          ← target - saved, over monthly amount
=IF(EDATE(TODAY(), G6)<=I6, "On track", "Behind")
Setting it up for 2027
- Categories first. Take this year's actuals, not a template's list. Drop what you did not use for nine months, keep Savings as a category so the rate counts it.
- Plan by month, not by year. Type the same amount across the row, then change the months that are different: gifts in December, insurance renewals, a trip. The sample's only change is Gifts 50 to 300 in December.
- Plan income you actually receive. The sample planned 650 a month of side and freelance income and logged it once in nine months. Budgeting on 4,850 when 4,200 arrives makes every month look under plan.
- One log, all year. Do not start a new file in February. The Month column and SUMIFS do the splitting.
- Log net worth on the last day of each month. Two numbers. By June you have a line, and the line is the point.
If your pay arrives every two weeks and the monthly plan never quite lines up with the pay dates, the paycheck budget article covers that split; and if the Debt payments row is the one you want to shrink fastest, start with snowball vs avalanche.
Skip the build
The formulas above are the skeleton: a month column, a SUMIFS grid, a savings rate and a net worth log. The template is that skeleton with the rest attached: a dashboard where you pick the month, bills you tick Paid with a bill calendar, accounts with running balances, debts with payoff dates, savings goals with On track / Behind, 50/30/20 tiles, and a Lite file with just the five tabs above if that is all you want.
Annual Budget Spreadsheet for Google Sheets and Excel
Two files in one download: Lite (5 tabs: Transactions, Dashboard, Monthly Budget, How to use, Lists) and Full (14 tabs with bills, bill calendar, accounts, debts, savings goals, net worth, annual overview, phone tab). Type the plan and the transactions in the yellow cells, everything else is calculated. Sample data inside, plus blank copies. Any currency, any start month.
Get the Annual Budget on Etsy →See it work
FAQ
What is the difference between a monthly budget and an annual budget spreadsheet?
A monthly budget is one month at a time, usually a new file or tab each month. An annual budget keeps all 12 months side by side in one grid, with one transactions log for the year. The point is the comparison: you see that groceries ran 508 a month against a 550 plan, that dining out was 78 against 180, and which month was the worst, without opening twelve files.
How do I calculate a savings rate in a spreadsheet?
Savings rate = (income - expenses + anything you logged under a Savings category) / income. In the sample, January is 4,200 income, 3,720.59 expenses and 400 moved to savings, so (479.41 + 400) / 4,200 = 21%. Counting the Savings transfers matters: if you log them as an expense and do not add them back, a month where you saved 400 looks worse than a month where you spent it.
Why does my best month always look like the current one?
Because the current month is not finished. In the sample, September shows a 48% savings rate and 1,943 left over, but five bills (internet, credit card minimum, student loan, car payment, phone) have not hit yet. They add up to 755. With them paid, September lands at 33%, in line with the other months. Compare complete months only, or add a 'left to pay' tile.
How many categories should an annual budget have?
Fewer than you think. The sample plans 17 expense categories, and after nine months four of them (Kids, Pets, Entertainment, Gifts) have zero actual and three more (Personal care, Clothing, Other) average under 10 a month. Start with 8 to 12, keep Savings as its own category so it can be counted in the savings rate, and merge anything you never use.
Should I track net worth in the same spreadsheet as the budget?
Yes, once a month, in a separate tab. The budget tells you the flow (income minus expenses); net worth tells you the stock (assets minus liabilities). In the sample the budget left 7,382.66 over nine months and net worth went from 8,300 to 26,400 in the same period, because the 401k and the paid-down loans move too. One line a month is enough to see the trend.
More from the blog
- Christmas Budget Planner: Gifts, Food and Travel in One Spreadsheet So January Does Not HurtA 2,000 holiday budget split into 7 categories, a gift budget per person, and the number most people never see: what is still planned but not yet bought. Real numbers from the template, plus the Google Sheets formulas.
- How to Budget a Biweekly Paycheck in Google Sheets (26 Paychecks, 12 Months of Bills)Why a monthly budget breaks when you are paid every two weeks, which months have three paychecks, and how to assign each bill to a paycheck with two formulas. Real numbers from the template.
- Debt Snowball vs Avalanche: Which Pays Off Debt Faster? (Same 5 Debts, Calculated)The same five debts run three ways in a spreadsheet: minimums only, snowball, avalanche. What actually changes the debt-free date, plus the Google Sheets formulas to check your own numbers.