 HeyPlanly
Habit Tracker in Google Sheets: Streaks and % Done with a Few Formulas
A habit tracker in a spreadsheet is one grid: days down, habits across, an x when it is done. Everything else, the streaks, the % done this week, the month view, is counting. Below are the formulas that do that counting, with the numbers from the template's sample: 8 habits tracked from 1 July to 12 September 2026, 74 days, 368 x marks.
COUNTIF, streaks with one helper column (=IF(E7="x",AD6+1,0)), and completion per week or month with COUNTIFS on the date column. Then judge each habit against its own weekly target, not against 100%: in the sample, the habit with the lowest completion (Workout, 43%) is the one that is exactly on plan.
The grid: one row per day, one x per habit
The Tracker tab has a date in column B and one column per habit (E to X, up to 20 habits). The habits themselves live on a separate Habits tab with a name, a target in days per week (7 = every day) and a start date. The sample has eight:
| Habit | Target / week | Starts | Days done | Completion |
|---|---|---|---|---|
| Drink 2 L of water | 7 | 1 Jul | 60 of 74 | 81% |
| In bed by 11 pm | 6 | 1 Jul | 56 of 74 | 76% |
| No phone after 10 pm | 7 | 1 Jul | 55 of 74 | 74% |
| Journal | 4 | 1 Aug | 29 of 43 | 67% |
| Read 20 pages | 5 | 1 Jul | 48 of 74 | 65% |
| Morning walk | 5 | 1 Jul | 45 of 74 | 61% |
| Meditate 10 min | 5 | 1 Jul | 43 of 74 | 58% |
| Workout | 3 | 1 Jul | 32 of 74 | 43% |
| All habits | 368 of 561 | 66% |
Note the Journal row. It started a month later, so it is counted from 1 August: 29 of 43 days. Counted from the first day of the tracker it would read 29 of 74, a misleading 39%. That is why each habit gets a start date, and why the daily "done" count only includes columns whose habit has started:
Y6: =COUNTIFS(E6:X6, "x", $E$4:$X$4, "<="&B6) ← row 4 holds each habit's start date
A plain =COUNTIF(E6:X6,"x") works too if all your habits start on the same day. Either way, the mark is a typed x, not a checkbox: checkboxes turn into TRUE/FALSE text or vanish when the file opens in Excel or a phone app, and an x counts the same everywhere.
Streaks: one helper column per habit
A streak is "days in a row with an x". The trick is to let every row carry the run forward. Next to the grid, one hidden column per habit:
AD6:  =IF(E6="x", 1, 0)
AD7:  =IF(E7="x", AD6+1, 0)        ← copy down 366 rows
Longest streak:  =MAX(AD6:AD371)
An x adds 1 to yesterday's value, a blank drops it to 0, and the longest run survives in the MAX. The current streak is the helper value on the last day you tracked anything. One refinement matters: if today is still blank because it is 8 am, look at yesterday instead, otherwise every streak shows 0 until you mark something.
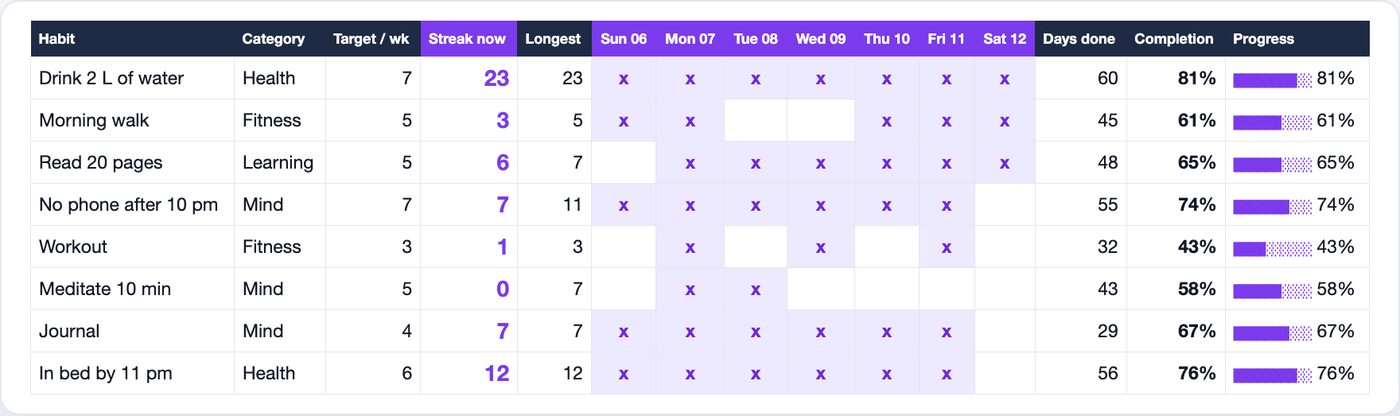
In the sample, water is on its best run ever (23 days, which is also its longest), bedtime is on 12, and Meditate sits at 0 with a record of 7. The last-7-days strip shows why: two x marks on Monday and Tuesday, then nothing.
% of target, not % of days
Completion (days done divided by days since the start) ranks Workout last at 43%. But Workout is planned three times a week, and 3 out of 7 days is 42.9%. It is exactly where it should be. The fair number is done against what the target expects for the days so far, capped at 100%:
=MIN(1, done / (target_per_week * days_so_far / 7))
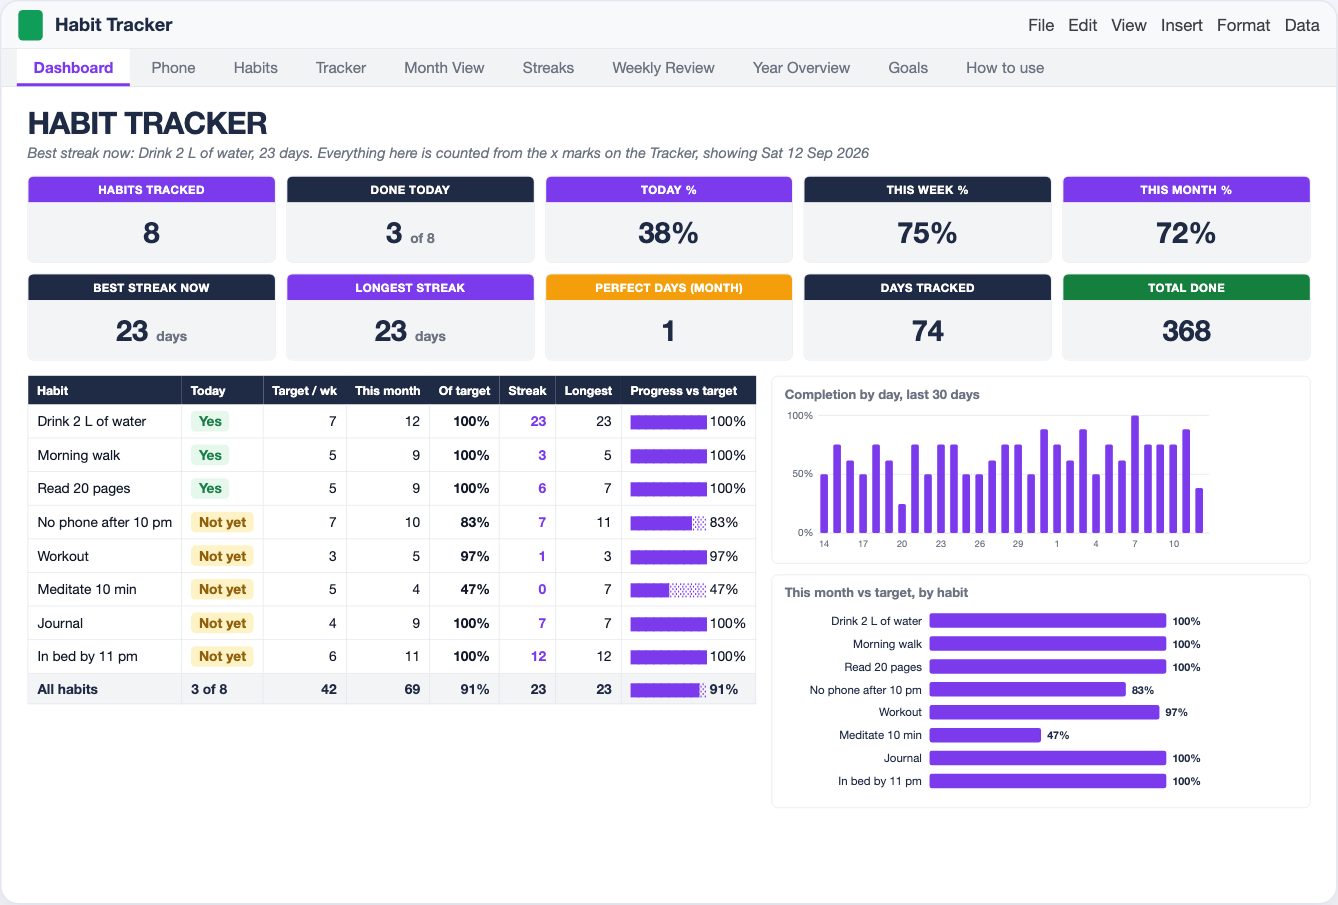
For September (1 to 12, 12 days) the dashboard shows:
| Habit | Target / week | Done, Sep 1-12 | Expected | Of target |
|---|---|---|---|---|
| Drink 2 L of water | 7 | 12 | 12.0 | 100% |
| In bed by 11 pm | 6 | 11 | 10.3 | 100% |
| No phone after 10 pm | 7 | 10 | 12.0 | 83% |
| Workout | 3 | 5 | 5.1 | 97% |
| Meditate 10 min | 5 | 4 | 8.6 | 47% |
| Read 20 pages, Morning walk, Journal | 5 / 5 / 4 | 9 / 9 / 9 | 8.6 / 8.6 / 6.9 | 100% |
Six of eight habits are at or near plan. The two that are not are the two with daily or near-daily targets that slipped (phone) or the one that is quietly dying (meditation). The month's count per habit is one COUNTIFS on the date column, the same pattern the annual budget uses for spending by month:
=COUNTIFS(Tracker!$E$6:$E$371, "x",
          Tracker!$B$6:$B$371, ">="&DATE(2026,9,1),
          Tracker!$B$6:$B$371, "<="&EOMONTH(DATE(2026,9,1),0))
The weekly review catches the slide early
Month totals hide direction. Four Monday-to-Sunday columns show it. The sample, weeks starting 17 August to 7 September (the last one is six days so far):
| Habit | Target | 17 Aug | 24 Aug | 31 Aug | 7 Sep |
|---|---|---|---|---|---|
| Drink 2 L of water | 7 | 4 | 7 | 7 | 6 |
| Read 20 pages | 5 | 3 | 4 | 4 | 6 |
| In bed by 11 pm | 6 | 3 | 4 | 7 | 5 |
| Workout | 3 | 2 | 3 | 3 | 3 |
| Meditate 10 min | 5 | 6 | 5 | 3 | 2 |
Meditation went 6, 5, 3, 2. In July and August it ran at 61% and 65% of days; in September it is at 4 of 12. The linked goal on the Goals tab ("90 days of meditation", target 75% completion) reads Behind at 58%, while "Sleep 7 hours every night" (linked to bedtime, target 75%) reads On track at 76%. A weekly number is the earliest place a slide like this shows up, three weeks before a monthly one would.
One more pattern the grid gives for free: by weekday, Monday is the best day in the sample (74% of habit-days done) and Saturday the worst (56%). If your weekend looks like that, a lower weekend target is more honest than a daily one you miss twice a week.
What to track, and what to skip
- Five to eight habits. The sample's eight already make a perfect day rare: 3 in 74 days (3 July, 6 August, 7 September). Every habit you add makes that tile emptier.
- Set a weekly target per habit. 7 for water, 3 for the gym. Without it the dashboard can only say "43%" and you will read it as failing.
- A start date per habit. New habits count from their first day, not from January.
- Keep the longest streak. A missed day resets the current one to 0; the record staying on screen is what makes day 1 of the next run tolerable.
- Look at the week, not the day. Today at 38% (3 of 8 by the time the dashboard was captured) means nothing at noon. The week at 75% does.
Skip the build
The formulas above are the core. The template wraps them into 11 tabs where you type in two (Habits and Tracker): a dashboard with the tiles and two charts, the classic month grid filled from the Tracker, streaks, the 4-week review with trend, a 12-month year view with Q1 to Q4, goals linked to habits with On track / Behind, and a phone tab. There is also a 3-tab Lite file: habit names in the Tracker header, an x per day, a small dashboard.
Habit Tracker Spreadsheet for Google Sheets and Excel
Two files in one download: Lite (3 tabs) and Full (11 tabs: Dashboard, Phone, Habits, Tracker 366 days x 20 habits, Month View, Streaks, Weekly Review, Year Overview, Goals, How to use). Type an x in the yellow cells, the rest is calculated. Sample data inside, plus blank copies. Any start date.
Get the Habit Tracker on Etsy →See it work
FAQ
How do I count a streak in Google Sheets?
Add one helper column per habit. In the first row: =IF(E6="x",1,0). In every row below: =IF(E7="x",AD6+1,0), which adds 1 to yesterday's run when today has an x and drops to 0 when it does not. The longest streak is =MAX(AD6:AD371). The current streak is the helper value on the last day you tracked anything; if today is still blank, take the day before, so an unmarked morning does not break a 23-day run.
Should I use checkboxes or an x in a habit tracker?
An x (or any letter) is sturdier. Checkboxes store TRUE/FALSE in Google Sheets but turn into plain text or disappear when the file is opened in Excel or some phone apps, and every formula built on them breaks. COUNTIF(range,"x") works the same in Google Sheets, Excel and the mobile apps.
What is a good habit completion rate?
Compare against your own target, not against 100%. A workout planned 3 times a week has a ceiling of 3/7 = 43% of days. In the sample, Workout shows 43% completion over 74 days, the lowest of eight habits, and it is exactly on plan: 97% of target in September. A habit planned for every day at 74% is further behind than that.
How do I handle a habit I started later?
Give each habit a start date and count only from it. In the sample, Journal starts on 1 August. Counted from 1 July it would read 29 of 74 days, 39%. Counted from its start it is 29 of 43 days, 67%, which is the real number. The same start date keeps early stray marks out of the totals.
What is a perfect day and should I track it?
A perfect day is one where every active habit got its x. It is fun to see but a poor main metric: with 8 habits, the sample has 3 perfect days in 74 (3 July, 6 August, 7 September) while the overall completion is 66%. Keep it as a small tile and judge the week by % of target instead.
More from the blog
- How to Price Handmade Products: Materials, Labor, Fees and ProfitA worked pricing example for handmade products: an 8 oz soy candle that costs 11.29 to make needs 23.99 on Etsy for a 40% margin after fees. Formulas, a price ladder from 20% to 70%, fee comparison and break-even.
- Home Bakery Pricing: Cost Per Serving, Cake Quotes and Your MarginHow a home bakery spreadsheet prices a cake by servings: 36 servings at 7.50 each, 342.38 with tax, a 50% deposit, and 173.67 of profit on a 149.33 cost, plus a bake plan built from confirmed orders.
- Side Hustle Bookkeeping: Profit and Loss in One TabHow a small business bookkeeping spreadsheet turns 35 income rows and 40 expenses into a monthly profit and loss: 12758.50 in, 4405.39 out, 8353.11 profit, a 65.5% margin and a quarterly tax set-aside.
- Subscription Tracker: What Your Subscriptions Cost Per YearWhat a subscription tracker spreadsheet shows for a list of 24 subscriptions: 310.32 a month and 3,723.87 a year once yearly, quarterly and weekly plans are normalized, 6 charges due in the next 7 days, a trial ending, and 5 unused subscriptions worth 875.63 a year.