 HeyPlanly
Side Hustle Bookkeeping: Profit and Loss in One Tab
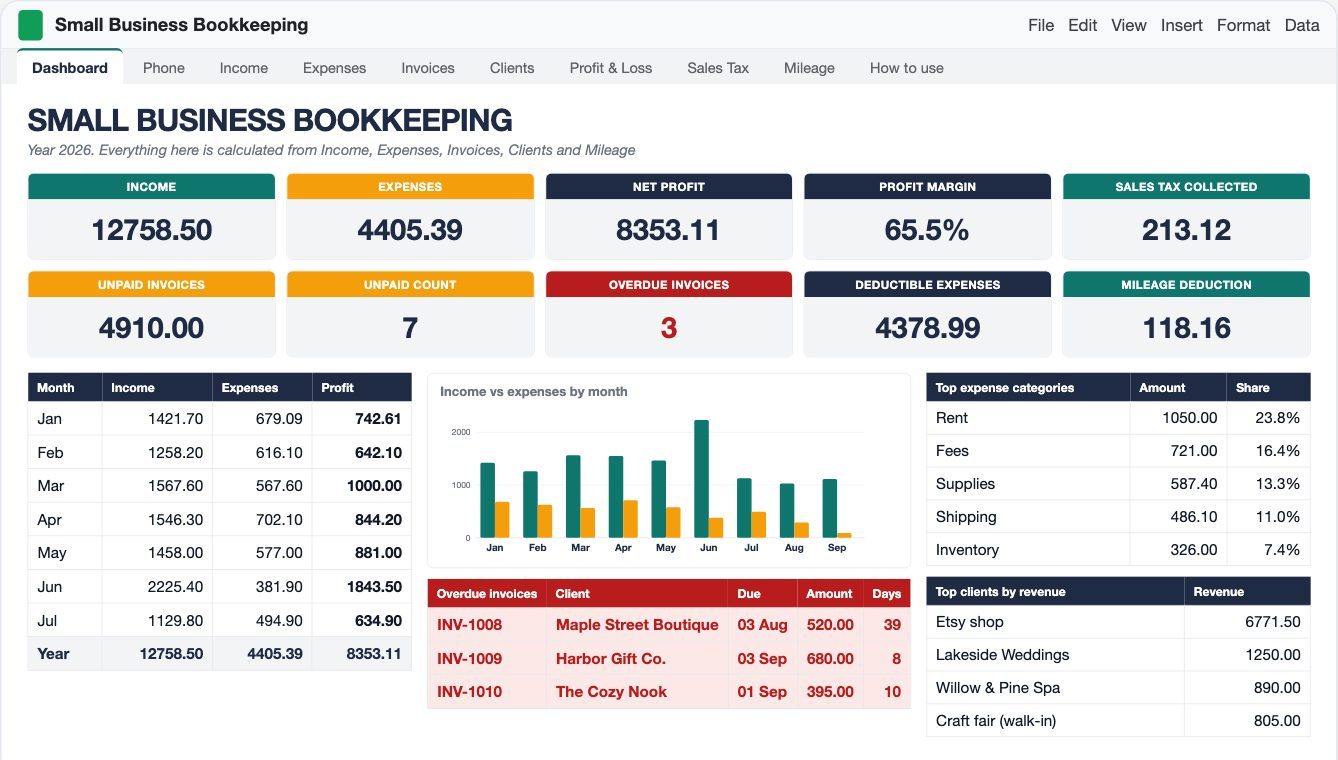
Most side hustles do not need accounting software. They need to know three things: how much came in, how much went out, and how much of the difference to put aside before tax time. All three come from the same two lists, sales and costs, added up by month. Below is the sample year from a small business bookkeeping spreadsheet, a candle shop selling on Etsy and wholesale, with every number shown so you can check the arithmetic.
Two logs: one row per sale, one row per cost
Everything starts on two tabs. On Income you type the date, the client, a category, a short description and the amount. On Expenses you type the date, the vendor, a category, the amount, and whether it is deductible and has a receipt. The month and the year are worked out from the date, so you never type them.
The sample shop logs Etsy payouts weekly or monthly rather than every single order, which keeps the Income tab short: 35 rows cover January to September. The first rows look like this: an Etsy payout of 412.50 and 48.00 of shipping collected on 5 January, then 142.00 of soy wax and 168.00 of fragrance oils on the expense side.
| Income category | Jan to Sep | Share |
|---|---|---|
| Product sales | 11924.50 | 93.5% |
| Services | 450.00 | 3.5% |
| Shipping collected | 324.00 | 2.5% |
| Other income | 60.00 | 0.5% |
| Total income | 12758.50 | 100% |
The profit and loss tab: SUMIFS by category and month
The P&L is a grid. Rows are your categories (4 for income, 16 for expenses), columns are January to December, and every cell is one SUMIFS that adds the amounts with that category, that month and the year set on the Dashboard. This is the real formula for the first income row in January:
=SUMIFS(Income!$F$6:$F$605, Income!$D$6:$D$605, $B7,
        Income!$M$6:$M$605, C$4, Income!$N$6:$N$605, Dashboard!$C$6)
Column F is the amount, D the category, M the month number and N the year. Because the category comes from $B7 and the month from C$4, the same formula fills the whole grid. Total income minus total expenses gives net profit for each month, and net profit divided by income gives the margin. Change the year on the Dashboard to 2027 and the whole tab switches to next year's rows, while this year's stay in the log.
Here is what the grid adds up to on the expense side, with the five biggest categories:
| Expense category | Jan to Sep | Share of expenses |
|---|---|---|
| Rent | 1050.00 | 23.8% |
| Fees | 721.00 | 16.4% |
| Supplies | 587.40 | 13.3% |
| Shipping | 486.10 | 11.0% |
| Inventory | 326.00 | 7.4% |
| Nine other categories | 1234.89 | 28.0% |
| Total expenses | 4405.39 | 100% |
So 12758.50 minus 4405.39 leaves 8353.11 of net profit, and 8353.11 divided by 12758.50 is a 65.5% margin. June is the strongest month in the sample, 2225.40 in and 381.90 out for 1843.50 of profit, mostly from one wholesale order of 1250.00.
Quarterly totals and the tax set-aside
Under the monthly grid, the P&L adds three months at a time. You type one number, your estimated income tax rate, and each quarter shows what to move to a separate account. The sample uses 25%:
| Quarter | Income | Expenses | Net profit | Set aside (25%) |
|---|---|---|---|---|
| Q1 (Jan to Mar) | 4247.50 | 1862.79 | 2384.71 | 596.18 |
| Q2 (Apr to Jun) | 5229.70 | 1661.00 | 3568.70 | 892.18 |
| Q3 (Jul to Sep) | 3281.30 | 881.60 | 2399.70 | 599.93 |
| Jan to Sep | 12758.50 | 4405.39 | 8353.11 | 2088.29 |
=IF(C42>0, ROUND(C42*$C$45, 2), 0)
C42 is the quarter's net profit and C45 is the rate. A quarter with a loss sets aside 0 instead of a negative number. The three quarters add up to 2088.29, one cent more than 25% of 8353.11 because each quarter is rounded on its own. The rate is your own estimate (federal plus state, or self-employment tax), not advice, so check it with whoever files your return.
Sales tax stays out of profit
Sales tax is money you collect for the state, so it sits in its own column on Income and never enters the P&L. In the sample, 10 of the 35 income rows are taxable, 3512.00 in total. Nine of them use the default 6% from the Dashboard, and one craft-fair service row of 120.00 has its own 8% rate typed in the optional column. That gives 203.52 plus 9.60, so 213.12 collected for the year, shown on the Dashboard and kept apart from the 12758.50 of income.
Deductible expenses are counted the same way, with one more condition. Rows marked Deductible = Yes add up to 4378.99 of the 4405.39 spent. The 10 mileage trips in the Full file, 168.8 miles at 0.70, add another 118.16. If you want to see what to log for each of those, Tax Deduction Tracker: what to log for each expense and Mileage Log: business miles, rate and the deduction go through it line by line.
Invoices: who still owes you
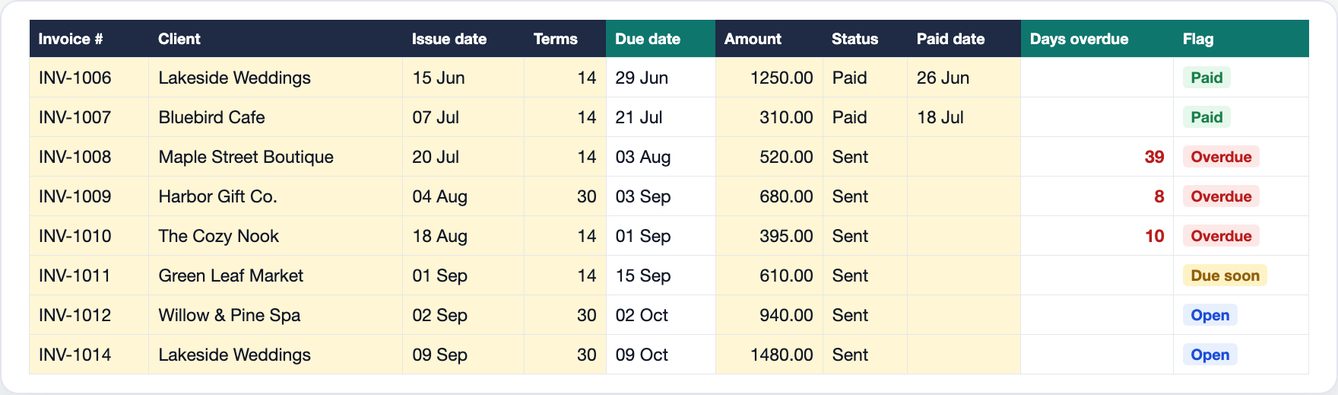
Profit on paper is not money in the bank. The Full file adds an Invoices tab: you type the client, issue date, terms in days and amount, and it works out the due date and a flag (Overdue, Due soon, Open or Paid). Unpaid is a SUMIFS on the status column:
=SUMIFS(Invoices!$F$6:$F$205, Invoices!$G$6:$G$205, "Sent")
In the sample, 14 invoices were issued, 7 are paid and 7 are still Sent, which adds up to 4910.00 of unpaid invoices. The largest is 1480.00 from Lakeside Weddings on 30-day terms.
Lite or Full: start with three tabs
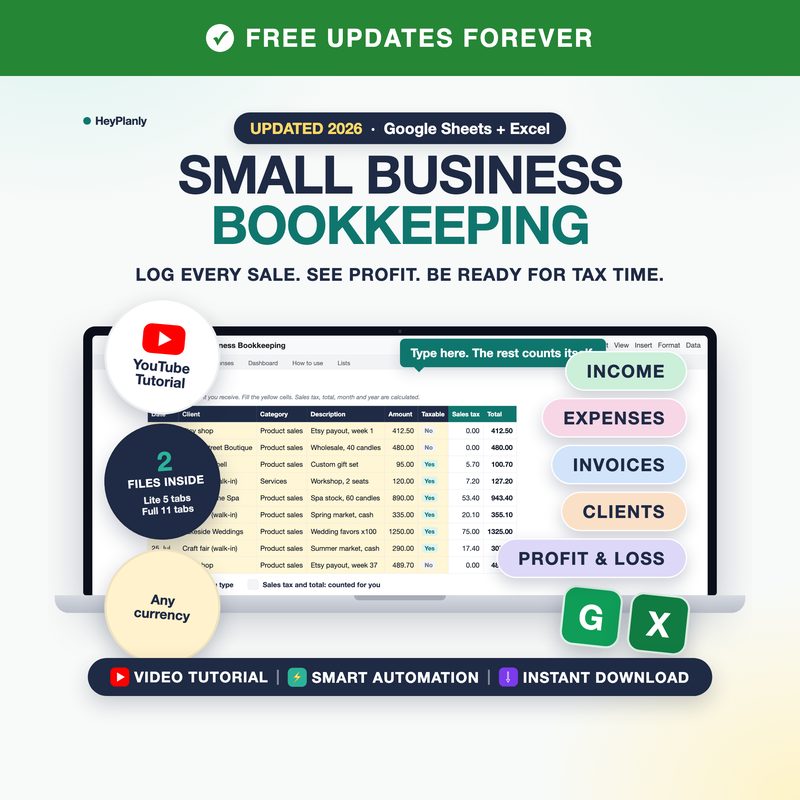
If you only need income, expenses and profit, open the Lite file: Income, Expenses and a Dashboard with income, expenses, net profit, margin, sales tax collected and deductible expenses, plus a monthly chart. The Full file adds Invoices, Clients, the monthly P&L with the quarterly set-aside, Sales Tax by month, Mileage and a Phone tab. The columns are the same in both, so rows paste across if you move up later.
Small Business Bookkeeping Spreadsheet for Google Sheets and Excel
Income and expense tracker with a profit dashboard, a monthly profit and loss with quarterly tax set-aside, invoices with overdue flags, clients, sales tax and mileage. Lite (5 tabs) and Full (11 tabs), sample data inside plus blank copies.
Get the Small Business Bookkeeping Spreadsheet on Etsy →FAQ
What is the simplest bookkeeping setup for a side hustle?
Two logs and one summary. Log every sale on an Income tab and every cost on an Expenses tab, each with a date, a category and an amount. A Profit and Loss tab then adds them up by category and month with SUMIFS. In the sample file that is 35 income rows and 40 expense rows for January to September.
How do I calculate profit margin for a small business?
Divide net profit by total income. In the sample year, income is 12758.50 and expenses are 4405.39, so net profit is 8353.11 and the margin is 8353.11 / 12758.50, which is 65.5%.
How much should I set aside for taxes each quarter?
Multiply each quarter's net profit by an estimated rate that you choose. The sample file uses 25%, which gives 596.18 for Q1, 892.18 for Q2 and 599.93 for Q3. The rate is a setting for your own estimate, not tax advice, so check it with your accountant or tax office.
Should sales tax count as income in my profit and loss?
No. Sales tax is collected for the state and passed on, so the sample file keeps it in a separate column. The 213.12 collected in the sample year is not part of the 12758.50 of income or the 8353.11 of profit.
Does this bookkeeping spreadsheet work in Excel and Google Sheets?
Yes. It is an .xlsx file that opens in Excel 2016 and later and in Google Sheets. It comes as a Lite file with 5 tabs (Income, Expenses, Dashboard, How to use, Lists) and a Full file with 11 tabs that adds invoices, clients, the monthly P&L, sales tax and mileage, plus blank copies of both.
More from the blog
- How to Price Handmade Products: Materials, Labor, Fees and ProfitA worked pricing example for handmade products: an 8 oz soy candle that costs 11.29 to make needs 23.99 on Etsy for a 40% margin after fees. Formulas, a price ladder from 20% to 70%, fee comparison and break-even.
- Home Bakery Pricing: Cost Per Serving, Cake Quotes and Your MarginHow a home bakery spreadsheet prices a cake by servings: 36 servings at 7.50 each, 342.38 with tax, a 50% deposit, and 173.67 of profit on a 149.33 cost, plus a bake plan built from confirmed orders.
- Subscription Tracker: What Your Subscriptions Cost Per YearWhat a subscription tracker spreadsheet shows for a list of 24 subscriptions: 310.32 a month and 3,723.87 a year once yearly, quarterly and weekly plans are normalized, 6 charges due in the next 7 days, a trial ending, and 5 unused subscriptions worth 875.63 a year.
- College Application Tracker: Deadlines, Fees and Essays Before 1 NovemberWhat a college application tracker spreadsheet shows five weeks before the first deadline: 10 colleges, 2 applications submitted, 415 in fees to pay, 2 of 9 essays done, 19 scholarships worth 83,250, and the real price of each college after aid, from 20,900 to 47,200 a year.