 HeyPlanly
Subscription Tracker: What Your Subscriptions Cost Per Year
Most people can name five of their subscriptions and are surprised by the next ten. The charges are small, they land on different days of the month, and the yearly ones arrive once and get forgotten. A subscription tracker is a spreadsheet that puts all of them in one list and does the two sums that matter: what they cost per month when every plan is normalized, and what that is per year. Below is the sample list from such a file, 24 subscriptions as of 18 September 2026, with the numbers shown so you can see what a tracker actually calculates.
The sample list: 24 subscriptions, 20 active
The list is an ordinary one: six streaming rows, three software plans, three cloud storage plans, three gym and fitness apps, two news subscriptions, two games, and five in Other, from Amazon Prime to a weekly coffee delivery and quarterly contact lenses. Twenty are Active. Apple TV+ and Audible are on a Trial. Hulu and the Peloton app are Cancelled and stay in the list as history.
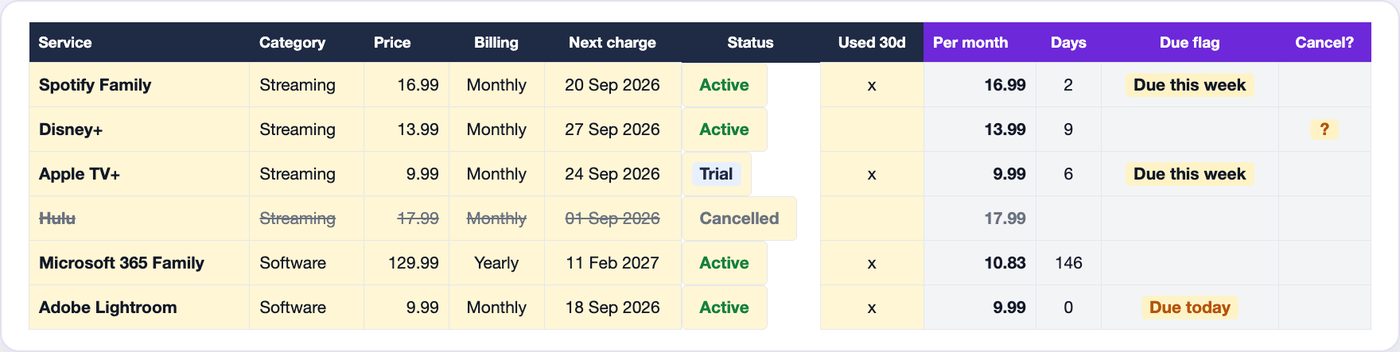
Each row takes seven typed cells: service, category, price, billing, next charge date, payment method and status, plus an x if you used it in the last 30 days. Everything to the right is a formula. The price is typed exactly as the service bills it, 129.99 a year for Microsoft 365 or 14.50 a week for the coffee, and the normalization happens in the next column.
Normalizing to a month: 152.41 of monthly plans, 310.32 in total
If you add up only the plans that bill monthly, the sample comes to 152.41 a month across 10 subscriptions. That is the number most people have in their head. The other 10 active subscriptions bill yearly, quarterly or weekly, and normalized to a month they add another 157.91. The true monthly cost is 310.32, about double the monthly-plans figure.
| Subscription | Billing | Price | Per month | Per year |
|---|---|---|---|---|
| Microsoft 365 Family | Yearly | 129.99 | 10.83 | 129.99 |
| Amazon Prime | Yearly | 139.00 | 11.58 | 139.00 |
| Google One 2 TB | Yearly | 99.99 | 8.33 | 99.99 |
| Duolingo Plus | Yearly | 83.99 | 7.00 | 83.99 |
| Strava | Yearly | 79.99 | 6.67 | 79.99 |
| Nintendo Switch Online | Yearly | 49.99 | 4.17 | 49.99 |
| Domain renewal | Yearly | 18.00 | 1.50 | 18.00 |
| Contact lenses | Quarterly | 90.00 | 30.00 | 360.00 |
| The Economist | Quarterly | 45.00 | 15.00 | 180.00 |
| Coffee beans delivery | Weekly | 14.50 | 62.83 | 754.00 |
| Not monthly, 10 plans | 157.91 | 1,894.95 | ||
| Monthly plans, 10 | Monthly | 152.41 | 1,828.92 | |
| All active, 20 | 310.32 | 3,723.87 |
Two things stand out. The seven yearly plans together cost 600.95 a year, which is only 50.08 a month, so they are not where the money goes. The single weekly plan is: 14.50 of coffee every week is 62.83 a month and 754 a year, more than the four streaming services together. The formula that does the normalizing reads the billing period from a dropdown:
=IF(OR(B7="",D7=""),"",
  IF(E7="Yearly",D7/12,
  IF(E7="Weekly",D7*52/12,
  IF(E7="Quarterly",D7/3,D7))))
B is the service, D the price, E the billing period. Per year is that cell times 12, and the two tiles at the top of the Dashboard add up the active rows only:
=SUMIFS(Subscriptions!$K$7:$K$106, Subscriptions!$H$7:$H$106, "Active")
Column K holds the monthly cost and H the status, so a cancelled row drops out of the total the moment its status changes, without deleting anything.
Where it goes: by category
Streaming is what people expect to see at the top, and in the sample it is the largest named category: 4 services, 60.46 a month, 19% of the total. But Other is bigger at 111.42, more than a third, because that is where the coffee, the lenses and Amazon Prime live. News is third at 40.00 for two subscriptions, more than the three cloud plans or the three software plans.
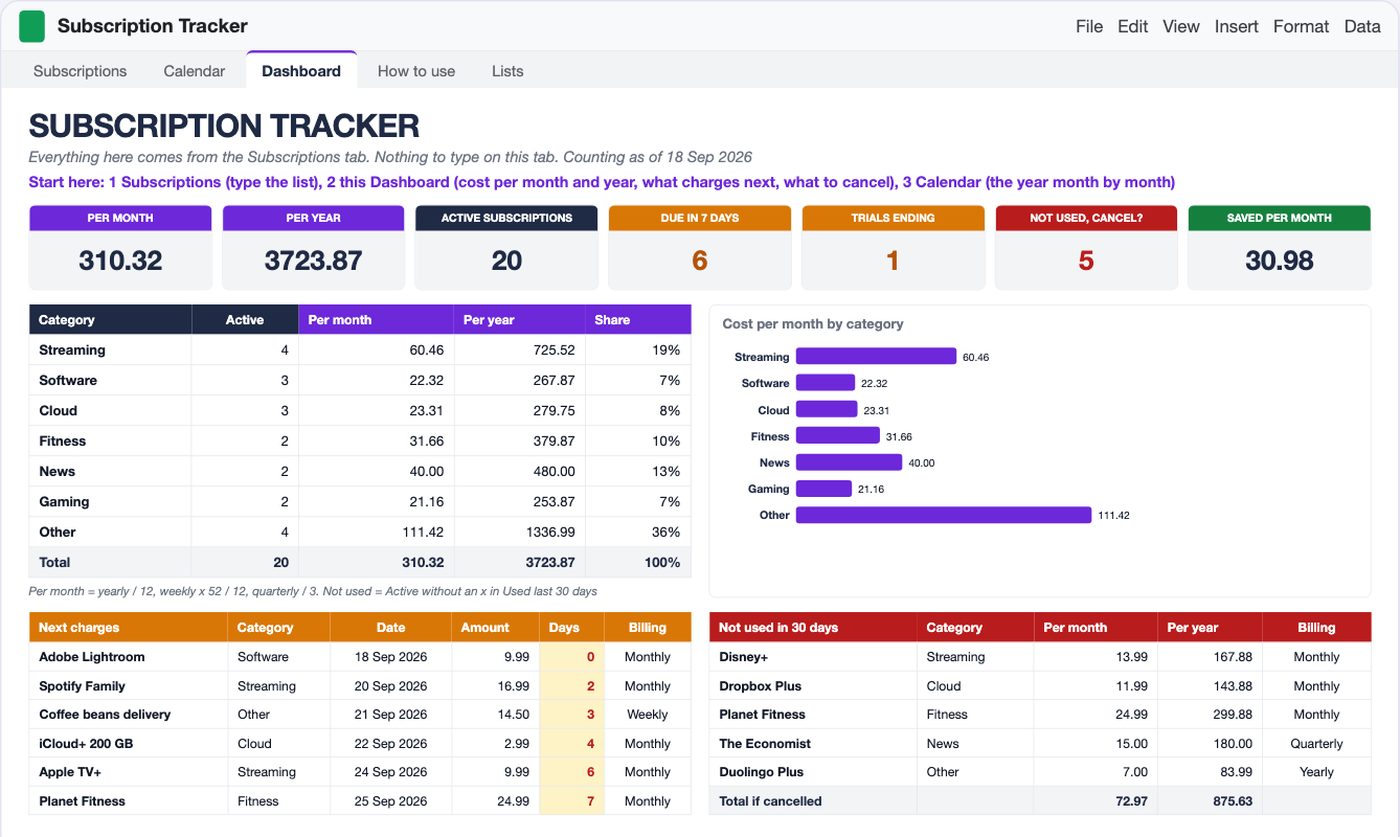
| Category | Active | Per month | Per year | Share |
|---|---|---|---|---|
| Other | 4 | 111.42 | 1,336.99 | 36% |
| Streaming | 4 | 60.46 | 725.52 | 19% |
| News | 2 | 40.00 | 480.00 | 13% |
| Fitness | 2 | 31.66 | 379.87 | 10% |
| Cloud | 3 | 23.31 | 279.75 | 8% |
| Software | 3 | 22.32 | 267.87 | 7% |
| Gaming | 2 | 21.16 | 253.87 | 7% |
| Total | 20 | 310.32 | 3,723.87 | 100% |
The category table is a COUNTIFS and a SUMIFS per row, filtered on the category and on Active, so the shares always add up to the per month tile:
=SUMIFS(Subscriptions!$K$7:$K$106,
        Subscriptions!$C$7:$C$106, B13,
        Subscriptions!$H$7:$H$106, "Active")
A list like this is the first place to look before the cancel list. Nobody is going to drop a 1.50 a month domain, but a 36% Other slice with a 754 a year coffee plan inside it is a real decision.
The next 7 days: 6 charges and a trial
The second job of the tracker is timing. On 18 September the sample has 6 charges due within a week, in date order: Adobe Lightroom today (9.99), Spotify Family in 2 days (16.99), the coffee delivery in 3 (14.50), iCloud+ in 4 (2.99), Apple TV+ in 6 (9.99) and Planet Fitness in 7 (24.99). That is 79.45 leaving the account in the next seven days, and the Apple TV+ row is the one to watch: it is a trial, so the 24 September date is the first charge, not a renewal. The Trials ending tile counts it.
The Next 10 charges list on the Dashboard continues with Disney+ in 9 days, Xbox Game Pass and Audible in 12, and the New York Times in 13. Below those ten, 12 more charges are scheduled on the Subscriptions tab. The list is sorted by a helper column that ranks every active row by its next date, so nothing on the Dashboard needs sorting by hand.
Dates that pass roll forward on their own. Dropbox Plus was due on 15 September, three days before the sample date, and the sheet shows it on 15 October with 27 days left: it adds whole billing periods until the date is today or later, a week for weekly plans and 1, 3 or 12 months for the rest. The only typing after a charge is none.
The cancel list: 875.63 a year not used
The third job is the one that pays for the file. Once a month you put an x next to what you actually used. Anything that is Active without an x gets a question mark:
=IF(AND(B7<>"", H7="Active", I7=""), "?", "")
In the sample that catches five rows: Disney+ (13.99 a month), Dropbox Plus (11.99), Planet Fitness (24.99), The Economist (15.00 a month from a quarterly 45) and Duolingo Plus (7.00 a month from a yearly 83.99). Together they cost 72.97 a month and 875.63 a year, counted with a SUMIFS over the question marks:
=SUMIFS(Subscriptions!$L$7:$L$106, Subscriptions!$O$7:$O$106, "?")
Column L is the yearly cost and O the cancel column. The yearly number is the one to look at, because 72.97 a month sounds like a gym fee and 875.63 a year sounds like a flight. Of the five, the gym is the expensive one at 299.88 a year, and the two annual plans are the easy ones to forget: Duolingo renews on 4 October for 83.99 whether or not anyone opened the app in September.
When you do cancel, the row stays. Hulu at 17.99 and the Peloton app at 12.99 are set to Cancelled in the sample, they grey out, drop from every total, and the Saved per month tile shows 30.98. If the five on the cancel list went the same way, that tile would read 103.95 and the per month total would fall from 310.32 to 237.35.
The year month by month: 215 to 417
The per month figure is an average. The Calendar tab shows what actually lands in each month: the 152.41 of monthly plans and the 62.83 weekly average are the same every month, and the quarterly and yearly charges are placed in the months they fall in.
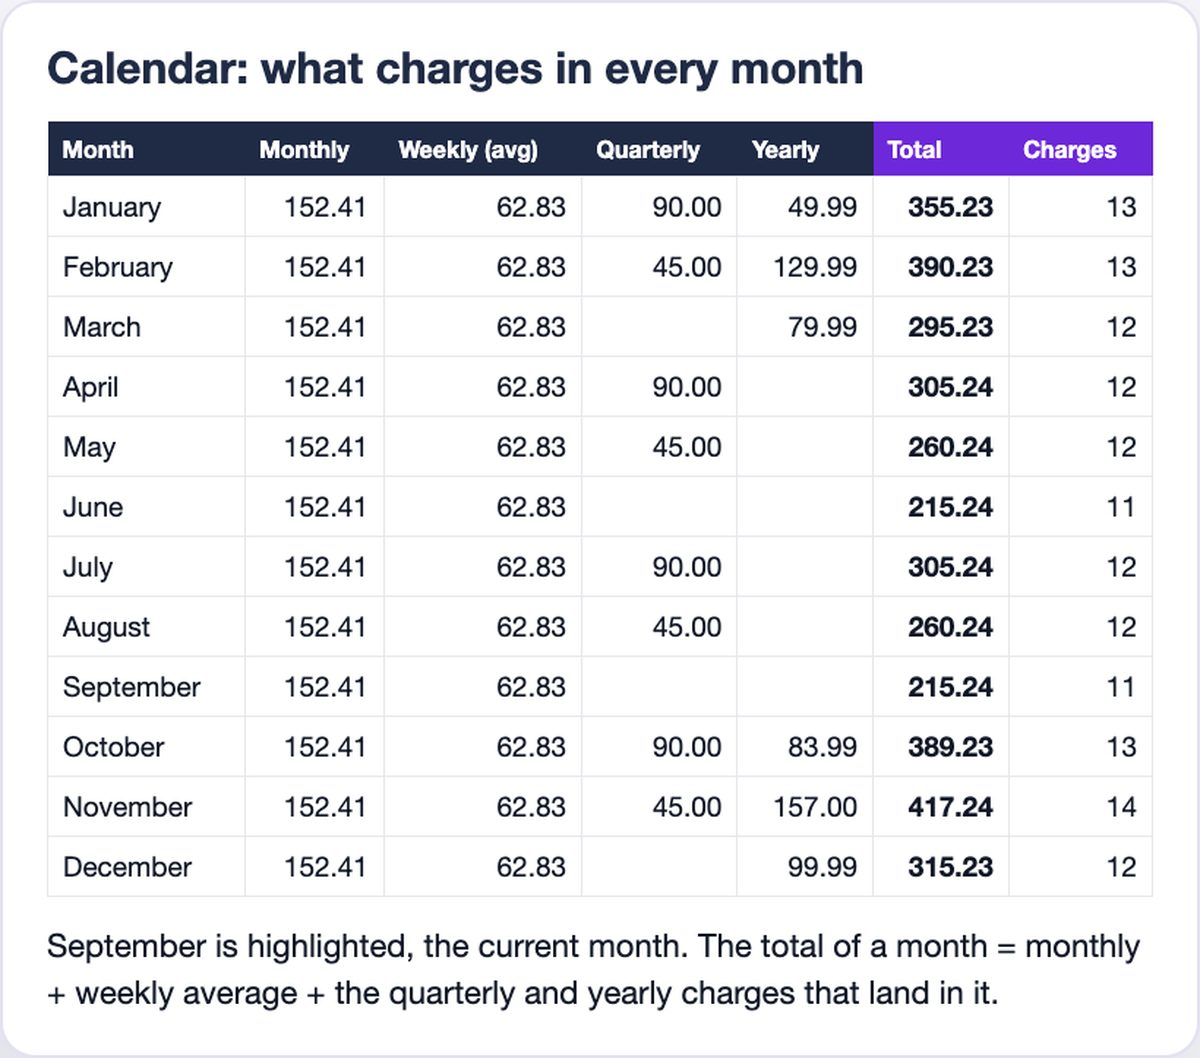
June and September are the cheapest months at 215.24 with 11 charges, nothing but the monthly and weekly plans. November is the most expensive at 417.24 and 14 charges, because Amazon Prime (139), the domain (18) and The Economist (45) all land in it. February is close behind at 390.23 with Microsoft 365 and the quarterly lenses. Over twelve months the Calendar adds up to the same 3,723.87 as the Dashboard tile, across 147 separate charges, and that count is the honest answer to "how often does my card get hit": about twelve times a month.
If you already keep a bill calendar for rent, insurance and utilities, the subscription Calendar is the same idea for the small recurring charges, and the November total is the kind of number that belongs in next year's annual budget rather than as a surprise on the statement.
Keeping it current
The list takes about 10 minutes to type for 20 subscriptions, mostly reading the last two card statements and the app store receipts. After that the upkeep is small: a new row when you sign up for something, a status change to Cancelled when you drop it, and an x once a month for what you used. Dates roll forward by themselves, the trial dates turn into renewals by themselves, and the Dashboard follows today's date each time the file opens. The sample uses a typed date of 18 September so the numbers above stay fixed. Clear that cell and the whole file counts from the real date.
Subscription Tracker for Google Sheets and Excel
One file, 5 tabs: Subscriptions with room for 100 rows, Calendar, Dashboard, How to use, Lists. Monthly, yearly, weekly and quarterly plans normalized to a month and a year, next charge dates that roll forward on their own, Due today and Due this week flags, trials counted before the first charge, the next 10 charges by date, cost by category with a chart, and a cancel list with the total you would save. Sample data inside plus a blank copy. Any currency.
Get the Subscription Tracker on Etsy →FAQ
How do you count a yearly subscription in a monthly total?
Divide the yearly price by 12 and put that next to the monthly ones. Microsoft 365 at 129.99 a year is 10.83 a month, Amazon Prime at 139 is 11.58. Quarterly plans divide by 3, weekly plans multiply by 52 and divide by 12. Then the per month total is the real amount that leaves your account on average, not only the monthly plans.
What does a subscription tracker spreadsheet need?
One row per subscription with the service, category, price, billing period, next charge date, payment method and status. From those seven cells the sheet counts the cost per month and per year, the days to the next charge, which charges are due this week, the next 10 charges in date order and what to cancel. The sample file has 24 rows and room for 100.
How do you find subscriptions you do not use?
Once a month put an x next to everything you actually used. Anything that is Active and has no x gets a question mark and lands on the cancel list with its cost per month and per year. In the sample that is 5 subscriptions, 72.97 a month and 875.63 a year.
What happens after a charge goes through?
Nothing to retype. When the next charge date passes, the sheet rolls it forward by the billing period: a week, a month, 3 months or a year. Dropbox Plus, due on 15 September, shows 15 October with 27 days left once 18 September comes around.
Does the tracker connect to my bank?
No. It is an .xlsx file for Google Sheets and Excel. You type the list once, about 10 minutes for 20 subscriptions, then an x once a month for what you used. Prices are plain numbers, so any currency works.
More from the blog
- How to Price Handmade Products: Materials, Labor, Fees and ProfitA worked pricing example for handmade products: an 8 oz soy candle that costs 11.29 to make needs 23.99 on Etsy for a 40% margin after fees. Formulas, a price ladder from 20% to 70%, fee comparison and break-even.
- Home Bakery Pricing: Cost Per Serving, Cake Quotes and Your MarginHow a home bakery spreadsheet prices a cake by servings: 36 servings at 7.50 each, 342.38 with tax, a 50% deposit, and 173.67 of profit on a 149.33 cost, plus a bake plan built from confirmed orders.
- Side Hustle Bookkeeping: Profit and Loss in One TabHow a small business bookkeeping spreadsheet turns 35 income rows and 40 expenses into a monthly profit and loss: 12758.50 in, 4405.39 out, 8353.11 profit, a 65.5% margin and a quarterly tax set-aside.
- College Application Tracker: Deadlines, Fees and Essays Before 1 NovemberWhat a college application tracker spreadsheet shows five weeks before the first deadline: 10 colleges, 2 applications submitted, 415 in fees to pay, 2 of 9 essays done, 19 scholarships worth 83,250, and the real price of each college after aid, from 20,900 to 47,200 a year.