 HeyPlanly
Mileage Log Spreadsheet: Business Miles, the Rate and the Deduction per Year
A mileage log is the deduction people lose most often, because nothing is paid when you drive and there is no receipt to find later. The fix is a log that is cheap to keep: one row per trip, the miles calculated, the totals already there in April. Below is the sample year from a mileage log spreadsheet, 113 trips from 5 January to 18 September 2026, with every number shown so you can see what a year of driving adds up to.
The sample year: two vehicles, 113 trips
The sample driver is a self-employed person with two vehicles: a Honda CR-V logged by odometer and a Ford Transit logged by typed miles. Between 5 January and 18 September there are 113 trips, 95 of them business and 18 personal. The business trips split into five purposes from the dropdown list on the Settings tab: client visits, deliveries, supplies, office and other.
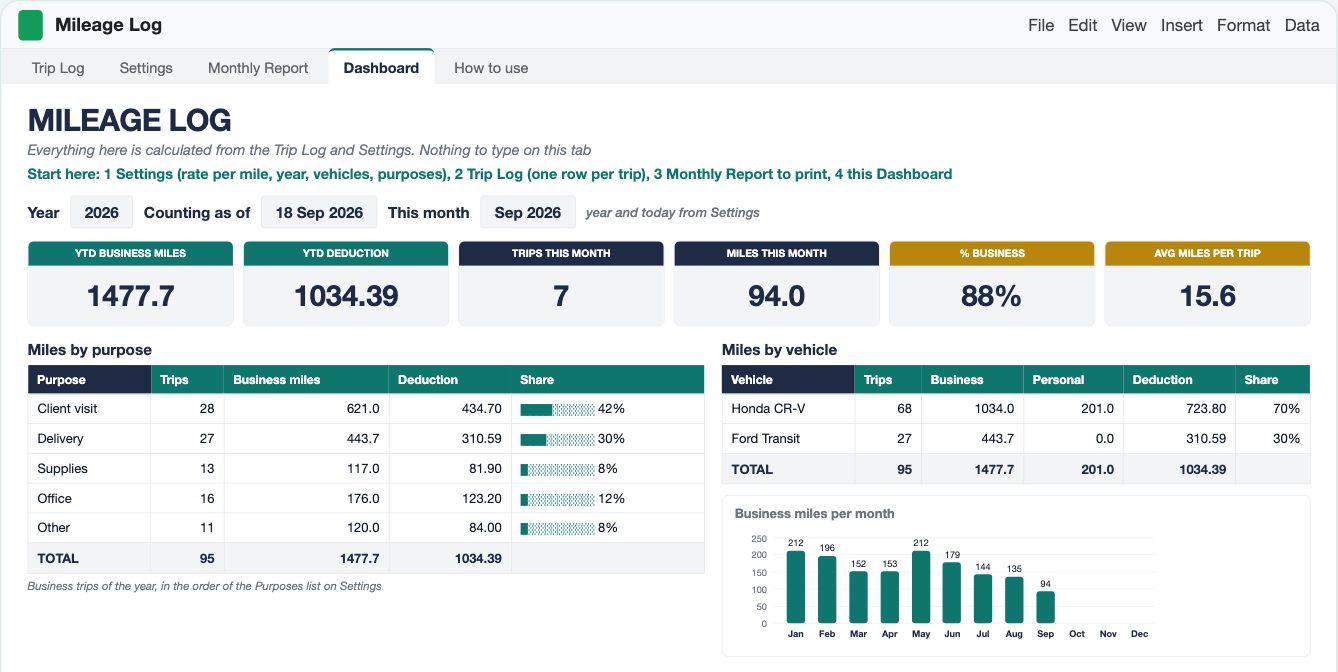
Client visits are less than a third of the trips but 42% of the miles, because they are the longest drives: 621.0 miles over 28 trips is 22.2 miles each. Deliveries average 16.4 miles, office days 11.0, supply runs 9.0. That is useful to know in October: if the year ends with the same pattern, the client visits are where the deduction comes from, and those are the trips to log carefully.
| Purpose | Trips | Business miles | Deduction | Share of miles | Miles per trip |
|---|---|---|---|---|---|
| Client visit | 28 | 621.0 | 434.70 | 42% | 22.2 |
| Delivery | 27 | 443.7 | 310.59 | 30% | 16.4 |
| Office | 16 | 176.0 | 123.20 | 12% | 11.0 |
| Supplies | 13 | 117.0 | 81.90 | 8% | 9.0 |
| Other | 11 | 120.0 | 84.00 | 8% | 10.9 |
| Total | 95 | 1,477.7 | 1,034.39 | 100% | 15.6 |
One row per trip: odometer or miles, your choice
Each trip is one row on the Trip Log: date, vehicle and purpose from dropdowns, from, to, then either the odometer at the start and the end or the miles typed by hand, an x if the trip was business, and a note. The grey columns do the rest.
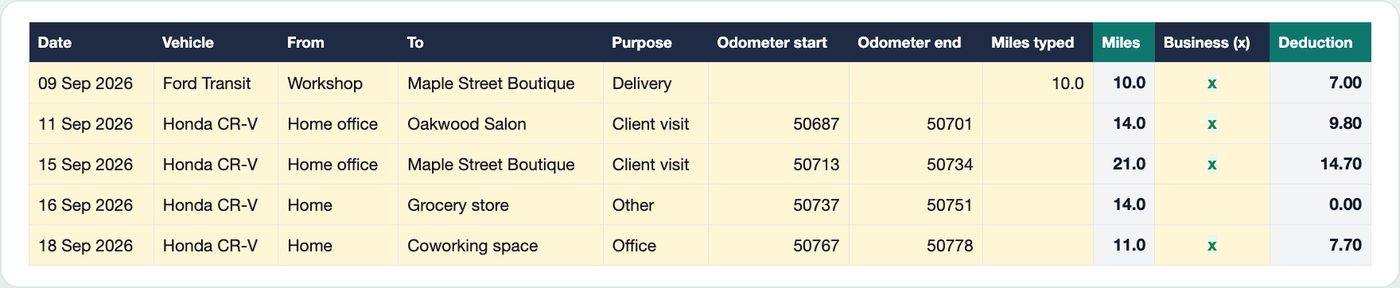
The miles come from the odometer when both readings are there, otherwise from the typed cell:
Miles:      =IF(B8="","",IF(AND(G8>0,H8>0),H8-G8,IF(I8="","",I8)))
Deduction:  =IF(B8="","",IF(AND(K8="x",J8<>""),ROUND(J8*Settings!$C$5,2),0))
G and H are the odometer cells, I the typed miles, J the result, K the Business cell, and Settings!C5 the rate. The 16 September row shows the personal case: a 14.0 mile drive to the grocery store with no x, so the deduction is 0.00 and the miles still count in the total. The sample mixes both ways of logging: 85 rows use the odometer and 28 use typed miles, 27 of them the Ford Transit and one a Honda trip on 14 January where the note says the driver forgot the reading and took 11 miles from the map. That is allowed; what matters is that the row was written at or near the time of the trip.
Parking and tolls go in the Notes column as text. The sample has four notes of 6.00 parking and three of 3.50 tolls, 34.50 in total, and the file does not add them up: they are expenses, not miles, and belong in an expense log. If you keep one, the tax deduction tracker has a line for them next to the mileage.
Month by month: what the report shows
The Monthly Report tab is twelve rows, one per month of the year typed on Settings, and a YEAR row. Each month has business miles, personal miles, total, business trips, all trips, deduction and % business. The current month is highlighted, and the months with no trips yet stay empty.
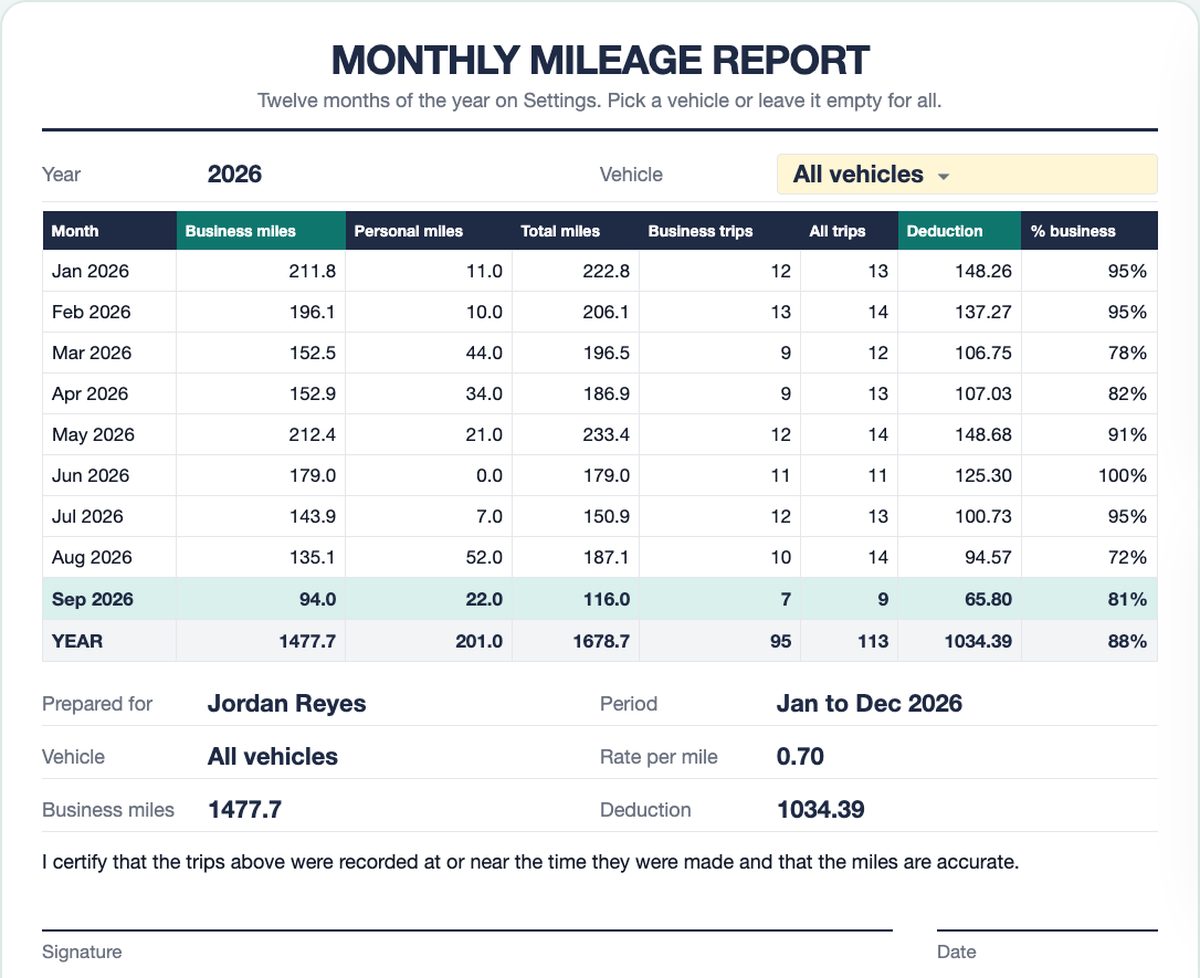
Two months stand out. May is the biggest at 212.4 business miles and 148.68 of deduction. August has the lowest % business, 72%, because of 52 personal miles against 135.1 business ones. June is 100% business only because no personal trips were logged that month, which is the kind of thing that looks odd on a report and is worth a glance before you print it. September is a partial month, 94.0 miles over 7 business trips to the 18th.
The month columns are SUMIFS and COUNTIFS on the Trip Log, with the month text in column N as the key. Business miles for a month, all vehicles:
=SUMIFS('Trip Log'!$J$8:$J$607, 'Trip Log'!$N$8:$N$607, "Sep 2026",
        'Trip Log'!$K$8:$K$607, "x")
That returns 94.0 on the sample. The business trip count is the same idea with COUNTIFS, and it only counts rows with miles above 0, so a dated row you have not finished yet does not inflate the trips:
=COUNTIFS('Trip Log'!$N$8:$N$607, "Sep 2026", 'Trip Log'!$K$8:$K$607, "x",
          'Trip Log'!$J$8:$J$607, ">0")
With a vehicle picked in the yellow cell at the top, every formula gets one more condition on the Vehicle column, and the report becomes one car only. For the Honda that is 1,034.0 business miles and 723.80; for the Transit 443.7 and 310.59.
The rate: one cell, and what a cent is worth
The deduction is business miles times the rate on Settings. The file ships with 0.70, and the note next to it says to check the current IRS standard mileage rate every January and type that; the sheet does not know the rate, it only multiplies. On the sample's 1,477.7 miles every cent of rate is 14.78 of deduction, so a rate that moves by three cents moves the year by 44.33. The same cell takes a rate per kilometre, or the per mile rate your employer reimburses, because the file does not care about the unit.
| Year to 18 September | Amount | How |
|---|---|---|
| Business miles | 1,477.7 | 95 business trips, 15.6 miles each on average |
| Deduction | 1,034.39 | 1,477.7 x 0.70 |
| Personal miles | 201.0 | 18 trips, no x, deduction 0 |
| Total miles | 1,678.7 | 1,477.7 + 201.0 |
| % business | 88% | 1,477.7 / 1,678.7 |
| Per month so far | 164.2 | 1,477.7 / 9 months, about 114.93 of deduction a month |
The % business line is why personal trips belong in the log at all. Some tax rules ask what share of the car's use is business, and 88% is only an honest number if the gym, the dentist and the grocery store are in there with no x. Leaving them out would not change the 1,034.39; marking them as business by mistake would add 201.0 x 0.70 = 140.70 that is not yours to claim.
A check you can only do with odometer rows
Odometer readings give you one thing typed miles cannot: a continuity check. The Honda's first reading in the sample is 48,237 on 5 January and the last is 50,778 on 18 September, so the car moved 2,541 miles. The log holds 1,235 of them, 1,034.0 business and 201.0 personal. The other 1,306 miles are drives that were never logged, which for a personal car is normal, but it tells you the 88% business figure describes the logged trips, not the car. If that share matters for your return, log more of the personal driving, even as one typed row per week.
Keeping it going after September
The habit that makes a log work is writing the row the same day. Set the rate and your vehicles once on Settings, keep the file open on your phone in the Google Sheets app, and type the trip from the parking lot: date, where, why, the odometer or the miles, an x. Twenty seconds per trip, 113 times a year in the sample. On 31 December the Monthly Report already says 12 months, the YEAR row already has the total, and the only April task is to copy one number.
Mileage Log Spreadsheet for Google Sheets and Excel
Trip Log with 600 rows, odometer or typed miles, business or personal, up to 6 vehicles. The deduction at the rate you type, a twelve month report that prints on one page with a signature line, and a dashboard by purpose and by vehicle. Sample data inside plus a blank copy. An IRS-style log, not tax advice: check the current rate and type it once.
Get the Mileage Log on Etsy →FAQ
What does a mileage log need for each trip?
The date, where you went from and to, the business purpose and the miles. In the sample file each row has those plus the vehicle, the odometer at the start and the end or the miles typed by hand, an x for business trips and a note. Miles and the deduction per trip are calculated.
How is the mileage deduction calculated?
Business miles times the rate per mile. In the sample 1,477.7 business miles at 0.70 give 1,034.39. The rate is typed once on the Settings tab; 0.70 is filled in, and you should check the current IRS rate every January and type that instead.
Do I have to read the odometer on every trip?
No. When both odometer cells are filled the sheet uses end minus start; otherwise it uses the Miles typed cell. The sample mixes both: 85 odometer rows for the Honda and 28 typed rows, 27 of them for the Ford Transit plus one trip where the driver forgot the reading and took the miles from a map.
Should personal trips go in the log?
Yes, with the Business cell empty. They count in the total miles and in the % business, not in the deduction. The sample has 18 personal trips and 201 miles, which brings the % business to 88%. Marking them as business by mistake would add 140.70 to the deduction that is not yours.
Can I print a mileage report for my employer?
Yes. The Monthly Report tab is one US Letter page: twelve months of business and personal miles, trips, deduction and % business, then your name, the period, the vehicle, the rate, the totals, a certify sentence and a signature line. Pick one vehicle in the yellow cell to print one report per car.
More from the blog
- How to Price Handmade Products: Materials, Labor, Fees and ProfitA worked pricing example for handmade products: an 8 oz soy candle that costs 11.29 to make needs 23.99 on Etsy for a 40% margin after fees. Formulas, a price ladder from 20% to 70%, fee comparison and break-even.
- Home Bakery Pricing: Cost Per Serving, Cake Quotes and Your MarginHow a home bakery spreadsheet prices a cake by servings: 36 servings at 7.50 each, 342.38 with tax, a 50% deposit, and 173.67 of profit on a 149.33 cost, plus a bake plan built from confirmed orders.
- Side Hustle Bookkeeping: Profit and Loss in One TabHow a small business bookkeeping spreadsheet turns 35 income rows and 40 expenses into a monthly profit and loss: 12758.50 in, 4405.39 out, 8353.11 profit, a 65.5% margin and a quarterly tax set-aside.
- Subscription Tracker: What Your Subscriptions Cost Per YearWhat a subscription tracker spreadsheet shows for a list of 24 subscriptions: 310.32 a month and 3,723.87 a year once yearly, quarterly and weekly plans are normalized, 6 charges due in the next 7 days, a trial ending, and 5 unused subscriptions worth 875.63 a year.