 HeyPlanly
50/30/20 Budget in Google Sheets: A One-Tab Monthly Budget
The 50/30/20 rule is easy to state and awkward to apply: your budget is a list of 16 or 20 categories, not three buckets. The fix is not a new budget. Keep the category list you already have, tag each line as a need, a want or savings, and let one formula per bucket do the split. Below is a real month from a simple budget spreadsheet's sample data, run through the rule, including the part where it does not fit.
The sample month: 3,200 in, 2,600 planned
The sample household has two income sources, a salary of 2,900 and a side gig of 300, and plans spending in 16 categories. Four more rows (Kids, Pets, Fun money, Other) are empty. Planned expenses add up to 2,600, which leaves 600 of income not assigned to anything.
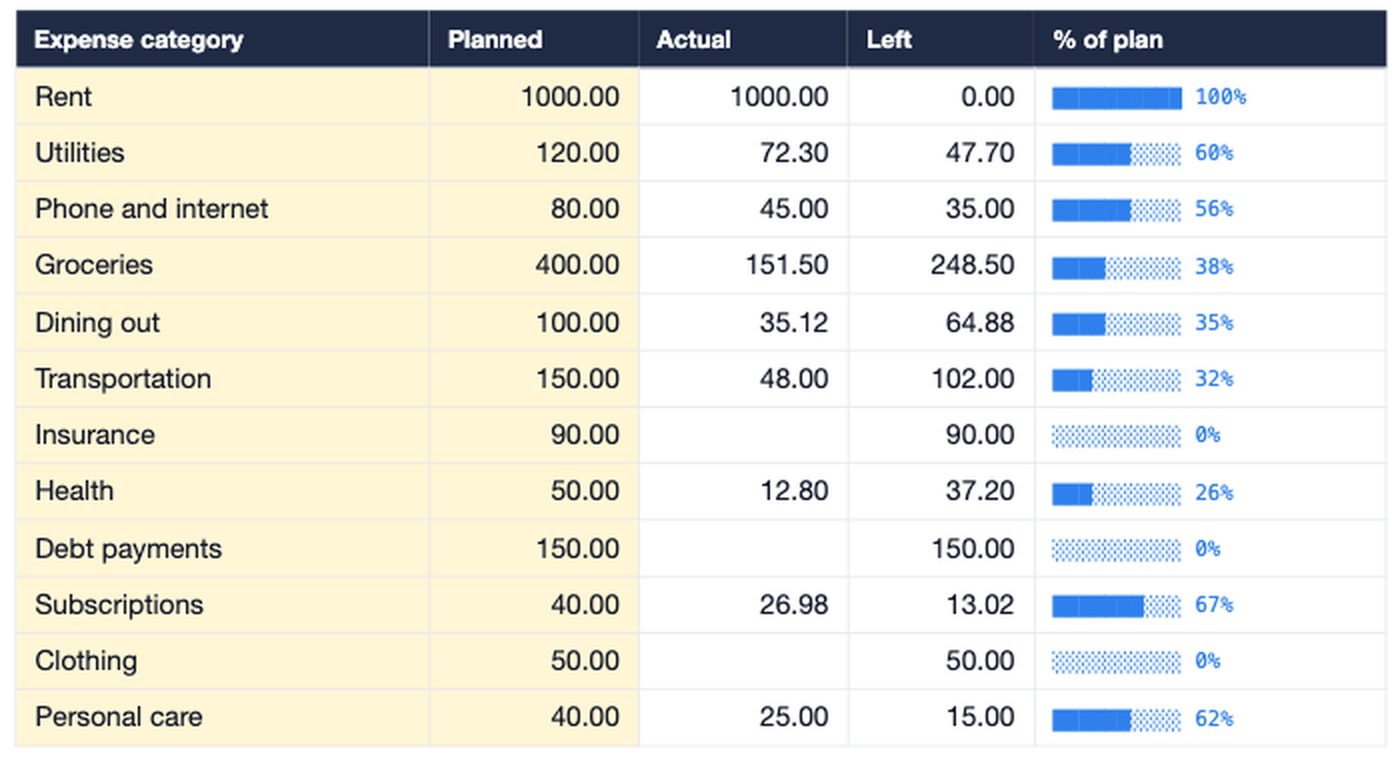
Nothing in this list says "need" or "want". That is the first job.
Step 1: sort every category into one of three groups
The rule of thumb: a need is something you would still pay if you lost your income for a month (housing, utilities, food at home, getting to work, insurance, minimum debt payments). A want is the part you could pause. Savings is money that leaves the monthly budget for later, including extra debt payments above the minimum. Here is the sample, sorted:
| Group | Categories (planned) | Planned | % of 3,200 | 50/30/20 target |
|---|---|---|---|---|
| Needs | Rent 1,000, Groceries 400, Transportation 150, Debt payments 150, Utilities 120, Insurance 90, Phone and internet 80, Health 50, Household 40 | 2,080 | 65.0% | 1,600 |
| Wants | Dining out 100, Entertainment 60, Clothing 50, Subscriptions 40, Personal care 40, Gifts 30 | 320 | 10.0% | 960 |
| Savings | Savings transfer 200 + unplanned 600 | 800 | 25.0% | 640 |
| Total | 3,200 | 100% | 3,200 |
Two of these calls are judgment, and you can make them differently. Household (cleaning supplies) is filed under needs here; Personal care (a haircut) under wants. Moving both would shift 80 between the groups, 2.5 points either way, and would not change the picture.
Step 2: let the sheet do the split
The simplest way to tag a category is in its name. Rename Rent to N: Rent, Dining out to W: Dining out, Savings to S: Savings. A SUMIFS with a wildcard then adds everything that starts with the same letter. On a small extra tab:
Needs planned:   =SUMIFS(Budget!$C$16:$C$35, Budget!$B$16:$B$35, "N:*")
Needs actual:    =SUMIFS(Budget!$D$16:$D$35, Budget!$B$16:$B$35, "N:*")
Share of income: =IF(Budget!$C$38=0, "", SUMIFS(Budget!$C$16:$C$35, Budget!$B$16:$B$35, "N:*") / Budget!$C$38)
C is the planned column, D the actual, B the category names and C38 total planned income. Swap "N:*" for "W:*" and "S:*" for the other two rows. The asterisk matches anything after the prefix, so the formula keeps working when you add a new need later.
One caution: rename at the start of a month, before you log anything. The actual amounts are matched to transactions by category name, so rows already logged as Rent will not count toward N: Rent until you change them too. If you would rather not rename at all, list the names inside the formula instead:
=SUMPRODUCT(SUMIFS(Budget!$C$16:$C$35, Budget!$B$16:$B$35,
  {"Rent","Utilities","Phone and internet","Groceries","Transportation",
   "Insurance","Health","Debt payments","Household"}))
That returns 2,080 on the sample. It works in both Google Sheets and Excel, but you have to edit the list whenever a category changes, which is why the prefix is easier to live with.
Step 3: read the result honestly
The sample misses the rule by a lot on needs: 2,080 against a target of 1,600, 480 over. Rent explains most of it. Without rent, needs are 1,080, 33.8% of income. For 2,080 of needs to be 50%, take-home pay would have to be 4,160.
What the check does show is that the budget is not careless. Wants are 320, a third of the 960 the rule allows, and savings are 25%, above the 20% target. When needs run high, 50/30/20 becomes 65/10/25 or similar, and that is a fine plan as long as the savings number holds. The point of the rule is to make the trade-off visible, not to force a split your rent does not allow.
If part of the 150 debt line could go toward paying a balance down faster, the snowball vs avalanche comparison shows what an extra 100 or 200 a month does to the payoff date.
Why the sheet says 19% and the rule says 25%
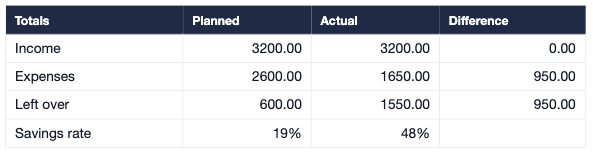
The budget's own savings rate is left over divided by income: 600 / 3,200 = 18.75%, shown as 19%. It treats the 200 transfer to savings as an expense, because from the checking account's point of view it is money going out. The 50/30/20 view counts it as savings, so the two add up to 800 and 25%. Both are correct; they answer different questions. If you want the sheet to match the rule, look at the S: group plus the left over.
The actual column says 48% mid-month, and that number should not be read as a result. On 12 September 1,650 of 2,600 has gone out, but insurance (90), debt payments (150) and most of the groceries are still ahead. The rate falls back toward the plan as those bills land.
Day to day: one number instead of three
Checking three percentages every day is more work than most people keep up. The Budget tab reduces the month to six tiles, and the one to watch between paydays is safe to spend per day: budget left divided by the days left in the month, today included.
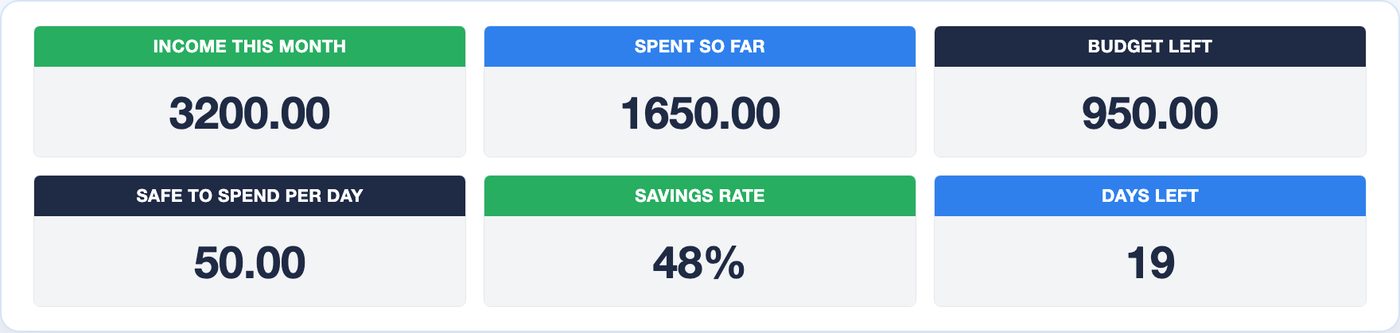
The 50/30/20 tags make that number more honest. Of the 950 left, 741.10 is still planned for needs (groceries 248.50, debt 150, transportation 102, insurance 90, and smaller lines) and only 208.90 for wants. Spread over 19 days, the wants part is 10.99 a day. That is the real room for dining out and the like, and it is a useful number to know before the weekend.
| On 12 September | Planned | Spent | Left |
|---|---|---|---|
| Needs | 2,080.00 | 1,338.90 | 741.10 |
| Wants | 320.00 | 111.10 | 208.90 |
| Savings transfer | 200.00 | 200.00 | 0.00 |
| Total | 2,600.00 | 1,650.00 | 950.00 |
If your pay arrives every two weeks and the month feels lumpy, the biweekly paycheck budget does the same planning per paycheck instead of per month.
Skip the setup
Everything above runs on a plain one-month budget: 6 income lines, 20 renamable categories, a transaction log and a totals block. The 50/30/20 split is three SUMIFS on top of it.
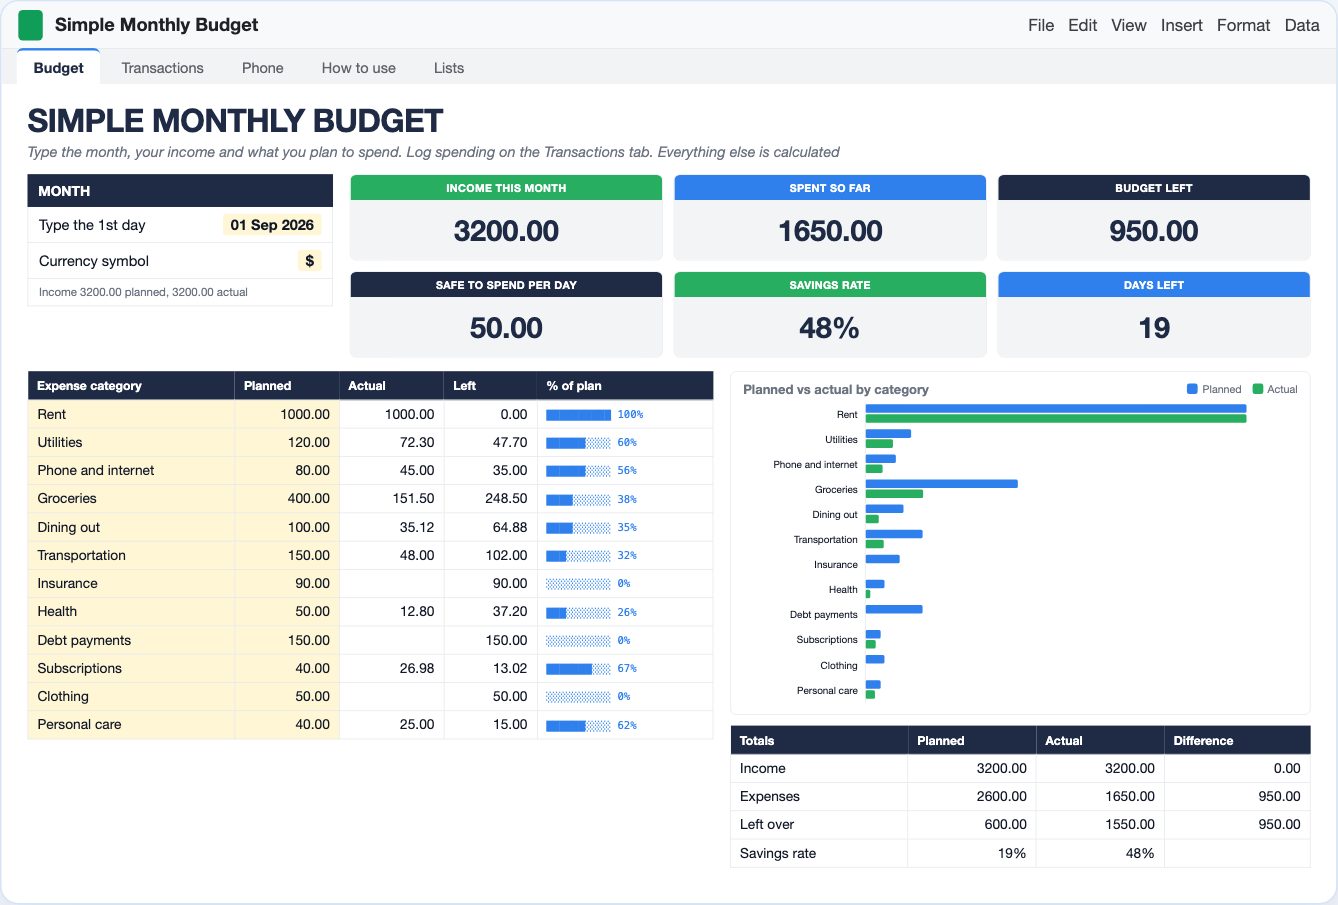
Simple Monthly Budget for Google Sheets and Excel
One month on one screen: type a planned amount per category, your fixed bills once, then one line per purchase. Six tiles, planned vs actual, safe to spend per day and a Phone tab are calculated. Rename the 20 categories for 50/30/20 or envelopes. Sample data and a blank copy.
Get the Simple Monthly Budget on Etsy →See it work
FAQ
What is the 50/30/20 budget rule?
Split take-home income three ways: 50% for needs (rent, utilities, groceries, insurance, minimum debt payments), 30% for wants (dining out, subscriptions, entertainment) and 20% for savings and extra debt payoff. On 3,200 a month that is 1,600, 960 and 640.
How do I do 50/30/20 in Google Sheets?
Keep your normal category list and tag each category as a need, a want or savings, for example by starting its name with N:, W: or S:. Then one SUMIFS per group adds the planned amounts: =SUMIFS(Budget!C16:C35, Budget!B16:B35, "N:*"). Divide by income to get the percentage.
What if my needs are more than 50%?
That is common, and usually it is rent. In the sample budget rent is 1,000 of 3,200 income, 31% on its own, and needs come to 65%. The rule still helps: it shows that wants are only 10% and savings 25%, so the budget is tight on needs, not loose on spending. To bring 2,080 of needs down to 50%, income would have to be 4,160.
Does money left unbudgeted count as savings?
In the 50/30/20 check, yes, if it stays in the account. The sample plans 2,600 of expenses on 3,200 income: the 200 savings transfer plus the 600 left unplanned make 800, which is 25%. The spreadsheet's own savings rate shows 19% because it counts the 200 transfer as an expense and only the 600 as left over.
Should I track 50/30/20 every day?
No. Check the split once, when you plan the month, and again at the end of it. Day to day, one number is more useful: safe to spend per day, which is budget left divided by days left. On 12 September in the sample that is 950 / 19 = 50.00.
More from the blog
- How to Price Handmade Products: Materials, Labor, Fees and ProfitA worked pricing example for handmade products: an 8 oz soy candle that costs 11.29 to make needs 23.99 on Etsy for a 40% margin after fees. Formulas, a price ladder from 20% to 70%, fee comparison and break-even.
- Home Bakery Pricing: Cost Per Serving, Cake Quotes and Your MarginHow a home bakery spreadsheet prices a cake by servings: 36 servings at 7.50 each, 342.38 with tax, a 50% deposit, and 173.67 of profit on a 149.33 cost, plus a bake plan built from confirmed orders.
- Side Hustle Bookkeeping: Profit and Loss in One TabHow a small business bookkeeping spreadsheet turns 35 income rows and 40 expenses into a monthly profit and loss: 12758.50 in, 4405.39 out, 8353.11 profit, a 65.5% margin and a quarterly tax set-aside.
- Subscription Tracker: What Your Subscriptions Cost Per YearWhat a subscription tracker spreadsheet shows for a list of 24 subscriptions: 310.32 a month and 3,723.87 a year once yearly, quarterly and weekly plans are normalized, 6 charges due in the next 7 days, a trial ending, and 5 unused subscriptions worth 875.63 a year.