 HeyPlanly
Bill Calendar Template: How to Never Miss a Due Date
Most missed bills are not a money problem, they are a visibility problem. The bill is somewhere in an email, an app or a paper envelope, and its due date is in your head. A bill calendar puts every due date on one month grid with the amount next to it. Below is a real month from a bill tracker's sample data: 17 bills, one overdue, six due within a week, and the formulas that keep the grid up to date on their own.
The sample month: 17 bills on one grid
The sample household has 18 bills in total. Fourteen are monthly, four are not: Amazon Prime (yearly, September), trash pickup (quarterly from March), renters insurance (twice a year, March and September) and car registration (yearly, April). In September 17 of them are due, and this is what the calendar shows on the 14th:
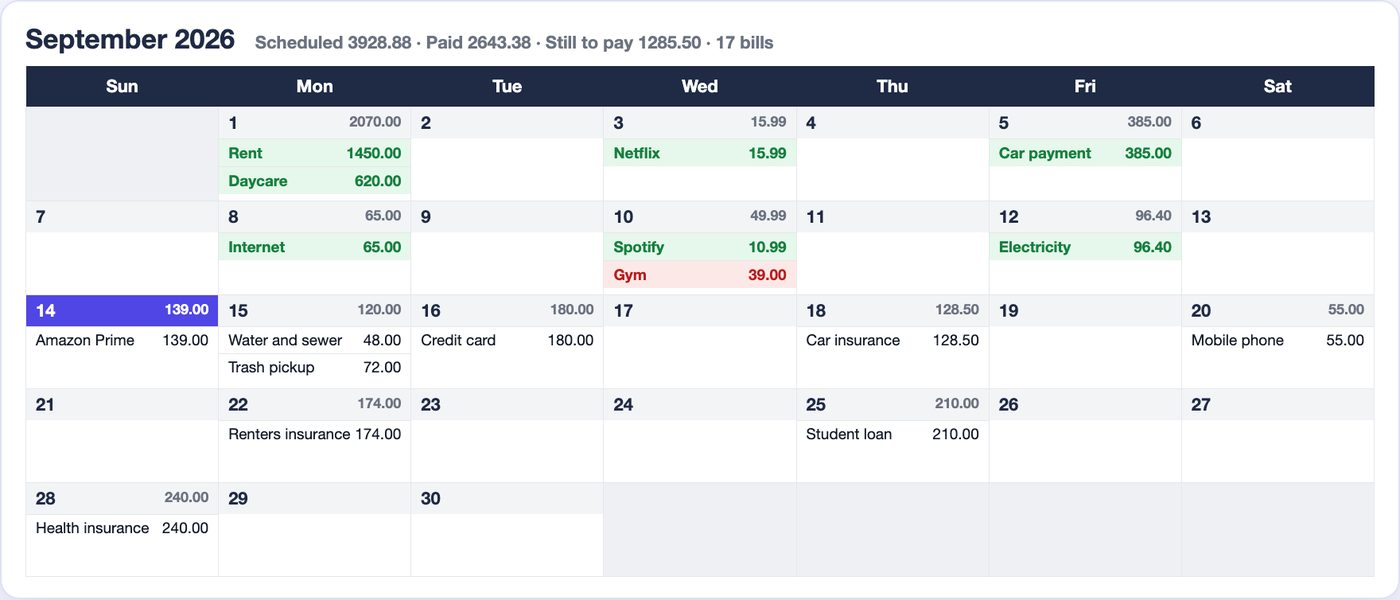
Three things are visible here that a list sorted by name hides:
- The 1st is heavy. Rent 1,450 and daycare 620 make 2,070, 52.7% of the month on a single day.
- The month splits unevenly. Bills due from the 1st to the 14th total 2,821.38; from the 15th to the 30th, 1,107.50. If you are paid twice a month, the first paycheck carries far more of the load.
- There is a gap. Nothing is due between the 23rd and the 27th, and nothing after the 28th.
If your pay comes every two weeks rather than twice a month, the biweekly paycheck budget shows how to match each paycheck to the bills it has to cover.
Status: Paid, Due or Overdue
Each bill gets one status for the selected month. It is Paid if a payment is logged for that month, Overdue if the due date has passed without one, and Due otherwise. The inputs are typed once in the yellow cells; due date and status are calculated:
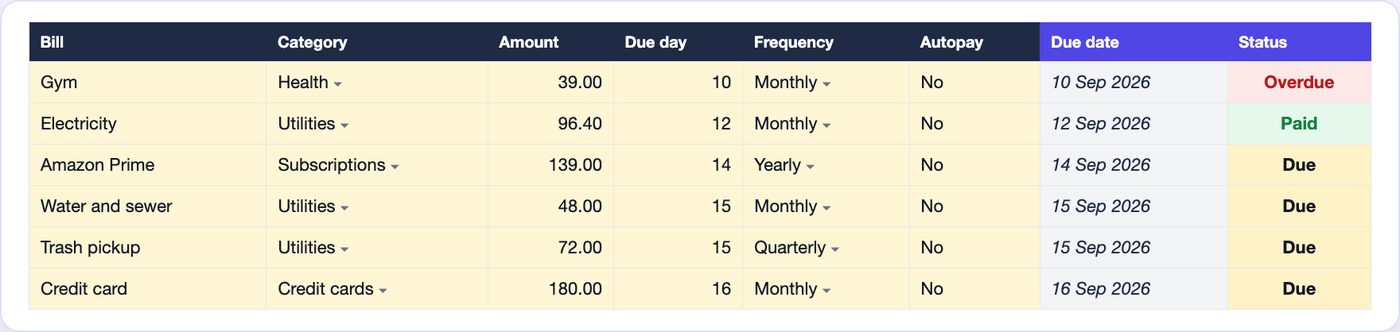
Due date:  =DATE(year, month, MIN(E6, DAY(EOMONTH(DATE(year, month, 1), 0))))
Status:    =IF(K6<>"Yes", "", IF(M6>0, "Paid", IF(L6<today, "Overdue", "Due")))
The MIN with EOMONTH matters for bills due on the 29th, 30th or 31st: in February a due day of 30 becomes the 28th instead of spilling into March. K is "due this month" (next section), M is the amount paid this month from the payment log, L is the due date.
Quarterly and yearly bills: the ones that get missed
A monthly bill trains you. A yearly one arrives once and catches you off guard. The tracker handles them with two inputs, frequency and first month, and one test:
Due this month: =IF(OR(O6=1, MOD(MONTH(month_start) - P6, O6)=0), "Yes", "No")
O is the period in months (1, 2, 3, 6 or 12), P is the number of the first month. Renters insurance has O = 6 and P = 3, so MOD(9 - 3, 6) = 0 in September and MOD(1 - 3, 6) = 4 in January: due in March and September only. The same four bills explain why the monthly totals are not flat:
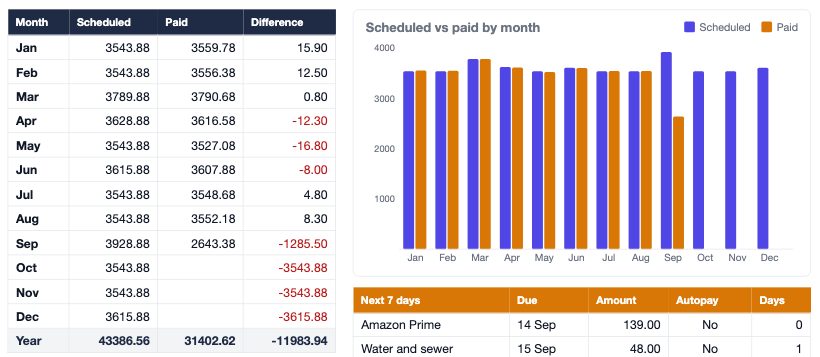
| Month | Bills due | Scheduled | Non-monthly bills in it |
|---|---|---|---|
| Jan, Feb, May, Jul, Aug, Oct, Nov | 14 | 3,543.88 | none |
| Mar | 16 | 3,789.88 | trash 72, renters insurance 174 |
| Apr | 15 | 3,628.88 | car registration 85 |
| Jun, Dec | 15 | 3,615.88 | trash 72 |
| Sep | 17 | 3,928.88 | Amazon Prime 139, trash 72, renters insurance 174 |
September is 385 above a normal month, 10.9% more. Over the year the four non-monthly bills add up to 860 (139 + 4 × 72 + 2 × 174 + 85), which is 71.67 a month if you set it aside instead of meeting it all at once. The full year is 43,386.56 scheduled, an average of 3,615.55 a month. An annual budget is the natural place to plan that 71.67.
The next 7 days: the one number to check
A full calendar is for planning. For day-to-day use, one number is enough: what is due in the next week and not paid yet. On 14 September it is 622.50:
| Bill | Due | Amount | Autopay |
|---|---|---|---|
| Amazon Prime | 14 Sep | 139.00 | No |
| Water and sewer | 15 Sep | 48.00 | No |
| Trash pickup | 15 Sep | 72.00 | No |
| Credit card | 16 Sep | 180.00 | No |
| Car insurance | 18 Sep | 128.50 | Yes |
| Mobile phone | 20 Sep | 55.00 | Yes |
| Total | 622.50 |
Next 7 days: =SUMIFS(D6:D45, N6:N45, "Due", L6:L45, "<=" & (TODAY()+7))
Renters insurance (174, due the 22nd) is just outside the window and appears the next morning. The overdue gym payment is not in this total because its status is Overdue; it has its own red tile, so it cannot hide inside a sum.
Spreadsheet vs app: what each is good at
An app can buzz your phone on the due date; a spreadsheet cannot. What the sheet does better is show everything at once: the whole month, the heavy days, the yearly bills months ahead, and a log of what you actually paid and when. The sample log shows why that log matters. There are 3 late payments this year: the gym paid on 14 February (due the 10th), the credit card on 19 May (due the 16th) and water on 20 July (due the 15th). All three are bills paid by hand. The 8 bills on autopay, 1,110.48 of September's total, need no reminder at all.
So the practical setup is both: autopay for fixed amounts you trust, a bank or phone reminder for the rest, and the calendar for the overview and the record. The sheet is where you notice that September is 385 heavier before it arrives.

Skip the build
The formulas above are the core: a due date that respects short months, a frequency test for non-monthly bills, a status, and a 7-day sum. The tracker wires them into a month grid, a checklist and a 12-month log.
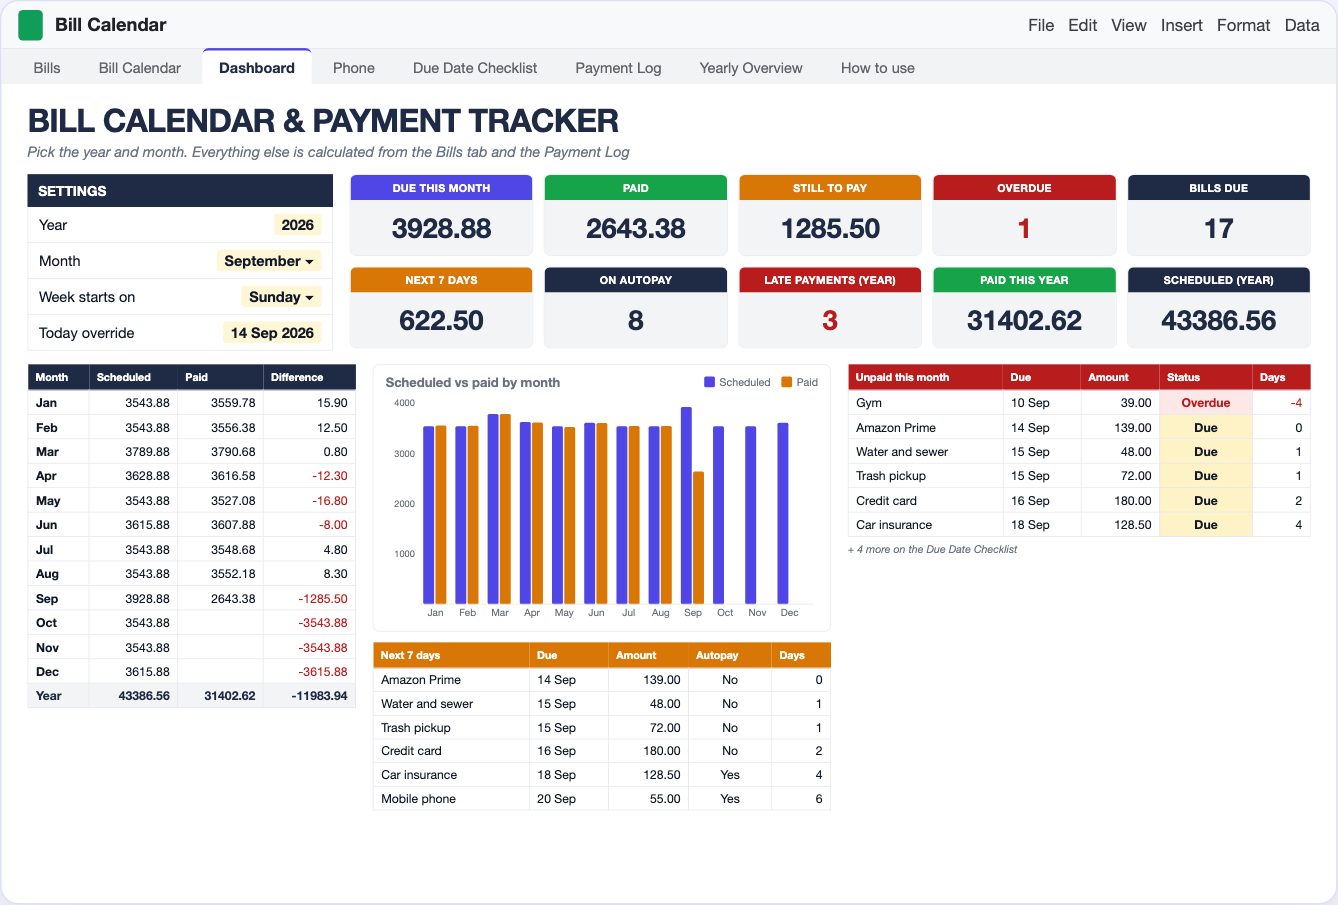
Bill Calendar & Payment Tracker for Google Sheets and Excel
Type each bill once: amount, due day, frequency (monthly to yearly), autopay. The month grid, due date checklist, next 7 days, overdue flags, late payments and the scheduled vs paid year are calculated. Two files: Lite (3 tabs) and Full (9 tabs), sample data and blank copies.
Get the Bill Calendar on Etsy →See it work
FAQ
What is a bill calendar?
A month grid where every bill sits on its due day with the amount, instead of a list sorted by name. In the sample September, 17 bills add up to 3,928.88; the grid shows at a glance that 2,070 of it lands on the 1st (rent and daycare) and that nothing is due between the 23rd and the 27th.
How do I track bills that are not monthly?
Give each bill a frequency and a first month, and let a formula decide whether it is due in the month you are looking at: =OR(period=1, MOD(month - first_month, period)=0). Renters insurance, twice a year starting in March, comes up in March and September; a quarterly trash bill starting in March comes up in March, June, September and December.
Why is one month's bill total higher than the others?
Because quarterly, twice-a-year and yearly bills stack up. In the sample the usual month is 3,543.88. September is 3,928.88: Amazon Prime (139, yearly), trash pickup (72, quarterly) and renters insurance (174, twice a year) all fall in the same month, 385 more than usual.
Is a spreadsheet or an app better for paying bills on time?
An app can send a push reminder; a spreadsheet cannot. A spreadsheet shows the whole month, the totals and the odd yearly bills in one view, and it keeps a log of what you paid and when. Many people use both: autopay or bank reminders for the alert, the sheet for the overview. In the sample, 8 of 17 bills are on autopay and all 3 late payments of the year were on bills paid by hand.
How do I calculate what is due in the next 7 days?
Sum the amount for bills whose status is Due and whose due date is no later than today plus 7: =SUMIFS(D6:D45, N6:N45, "Due", L6:L45, "<="&(TODAY()+7)). On 14 September in the sample that is 622.50 across six bills, from Amazon Prime on the 14th to the mobile phone on the 20th.
More from the blog
- How to Price Handmade Products: Materials, Labor, Fees and ProfitA worked pricing example for handmade products: an 8 oz soy candle that costs 11.29 to make needs 23.99 on Etsy for a 40% margin after fees. Formulas, a price ladder from 20% to 70%, fee comparison and break-even.
- Home Bakery Pricing: Cost Per Serving, Cake Quotes and Your MarginHow a home bakery spreadsheet prices a cake by servings: 36 servings at 7.50 each, 342.38 with tax, a 50% deposit, and 173.67 of profit on a 149.33 cost, plus a bake plan built from confirmed orders.
- Side Hustle Bookkeeping: Profit and Loss in One TabHow a small business bookkeeping spreadsheet turns 35 income rows and 40 expenses into a monthly profit and loss: 12758.50 in, 4405.39 out, 8353.11 profit, a 65.5% margin and a quarterly tax set-aside.
- Subscription Tracker: What Your Subscriptions Cost Per YearWhat a subscription tracker spreadsheet shows for a list of 24 subscriptions: 310.32 a month and 3,723.87 a year once yearly, quarterly and weekly plans are normalized, 6 charges due in the next 7 days, a trial ending, and 5 unused subscriptions worth 875.63 a year.