 HeyPlanly
College Application Tracker: Deadlines, Fees and Essays Before 1 November
By late September a senior who is applying early has about five weeks left. The first deadlines cluster on 1 November and 15 November, scholarships come due in between, essays have word limits, and three teachers are each holding a letter. A college application tracker is a spreadsheet that puts all of that in one list and counts what is ready. Below is the sample student from such a file, Maya Collins, Class of 2027, as of 27 September 2026, with the numbers shown so you can see what a tracker actually calculates.
The sample list: 10 colleges, 2 applications in
Maya's list has 10 colleges, 4 public and 6 private, from a 33 mile drive to 760 miles away, split into 3 Likely, 3 Target and 4 Reach. Two applications are already submitted: Cedar Valley State, a rolling admission school that answered with an acceptance on 22 September, and Pinecrest, submitted on 20 September for Early Action. The other eight are the autumn's work.
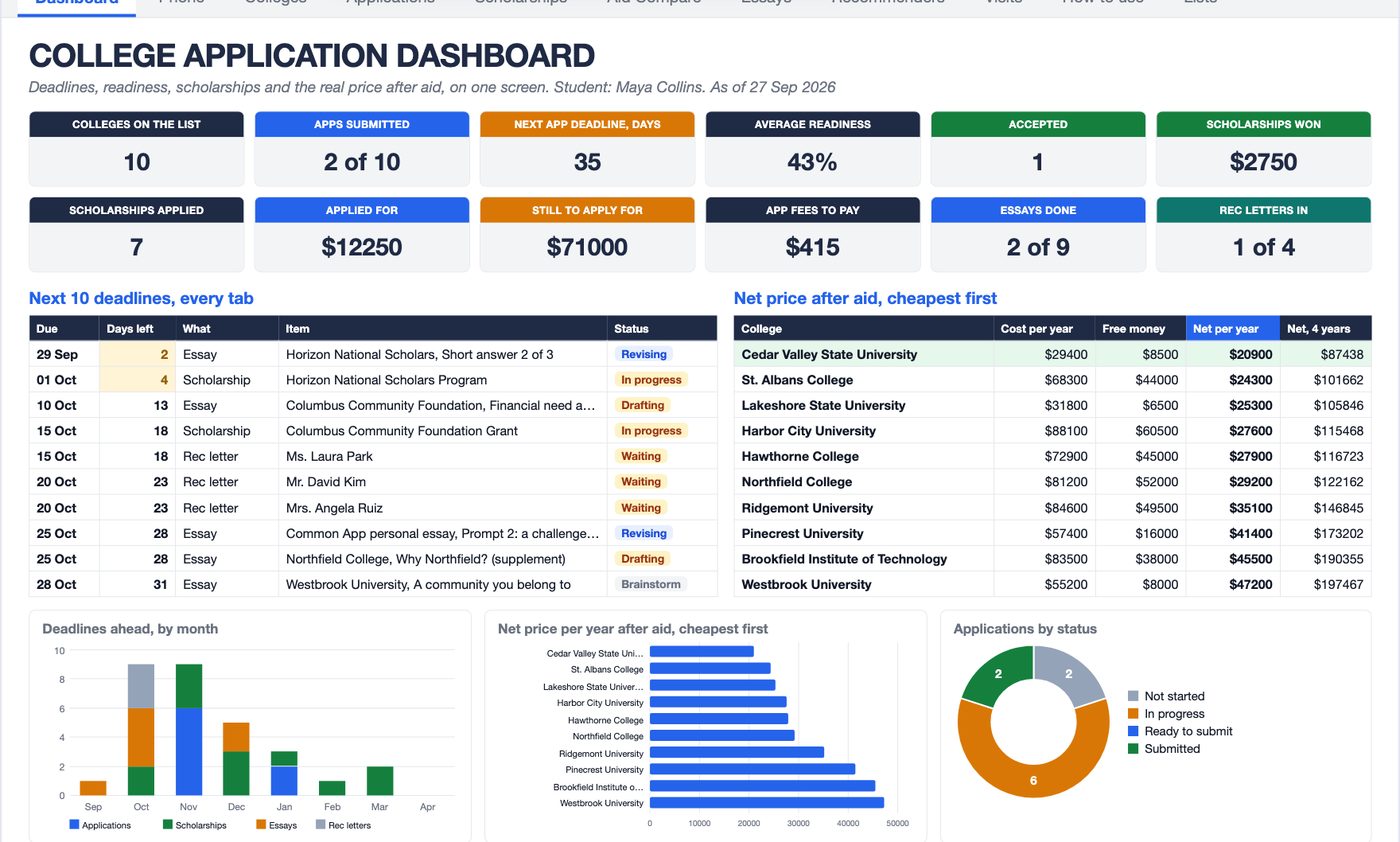
Two tiles matter most in October: 35 days to the next application deadline, and 43% average readiness. The second number is low because two Regular Decision applications have not been started and three Early Action ones have only one or two parts done. That is normal in September. What the tracker adds is that you can see which parts.
| College | Plan | Deadline | Days left | Ready | Status |
|---|---|---|---|---|---|
| Cedar Valley State University | Rolling | 1 Sep | done | 100% | Accepted 22 Sep |
| Pinecrest University | EA | 1 Nov | done | 100% | Submitted 20 Sep |
| Lakeshore State University | EA | 1 Nov | 35 | 67% | In progress |
| Northfield College | ED | 1 Nov | 35 | 50% | In progress |
| Westbrook University | EA | 1 Nov | 35 | 33% | In progress |
| Hawthorne College | EA | 15 Nov | 49 | 33% | In progress |
| St. Albans College | EA | 15 Nov | 49 | 33% | In progress |
| Brookfield Institute of Technology | EA | 15 Nov | 49 | 17% | In progress |
| Harbor City University | RD | 1 Jan | 96 | 0% | Not started |
| Ridgemont University | RD | 5 Jan | 100 | 0% | Not started |
Three applications share the 1 November deadline and three more share 15 November. That is the real shape of an early season: not ten deadlines spread over the autumn, but two days on which most of the work is due at once.
The checklist: six parts, and what Ready % means
Each application row has six checklist cells: application form, essays, transcript sent, test scores sent, recommendations, fee paid or waived. You type an x when a part is done and n/a when the college does not ask for it. Lakeshore State does not require recommendations, Hawthorne and St. Albans charge no fee, so those cells are n/a and count as done. Ready % is the done parts divided by six:
=IF(B6="","",ROUND((COUNTIF(I6:N6,"x")+COUNTIF(I6:N6,"n/a"))/6,4))
Northfield, the Early Decision first choice, has the form, the transcript and the test scores done: 3 of 6, 50%. The Next step column reads the first empty cell in order and says what to do: for Northfield and Lakeshore it is "Finish the essays", for Brookfield "Fill in the application form". Submitting the three 1 November applications would move the 43% average to 58% without touching the 15 November schools.
The fee column adds up too. The ten colleges list 490 in application fees; Northfield's 75 is covered by a fee waiver, which leaves 415, counted with a SUMIFS over the rows where the waiver cell is not Yes:
=SUMIFS(Applications!$F$6:$F$105, Applications!$B$6:$B$105, "?*",
        Applications!$G$6:$G$105, "<>Yes")
Pinecrest's 65 is in that number even though it was paid on 20 September, because the tile shows fees without a waiver, not fees outstanding. Of the eight applications still to send, two cost nothing, Northfield's fee is waived, and the other five cost between 50 and 80 each.
Every deadline in one list
The part of the file that gets used daily is the Next 10 deadlines table. It reads four tabs, Applications, Scholarships, Essays and Recommenders, keeps only the open items and sorts them by date. Open means an application not submitted, a scholarship in Researching or In progress, an essay not Final or Submitted, and a letter not in.
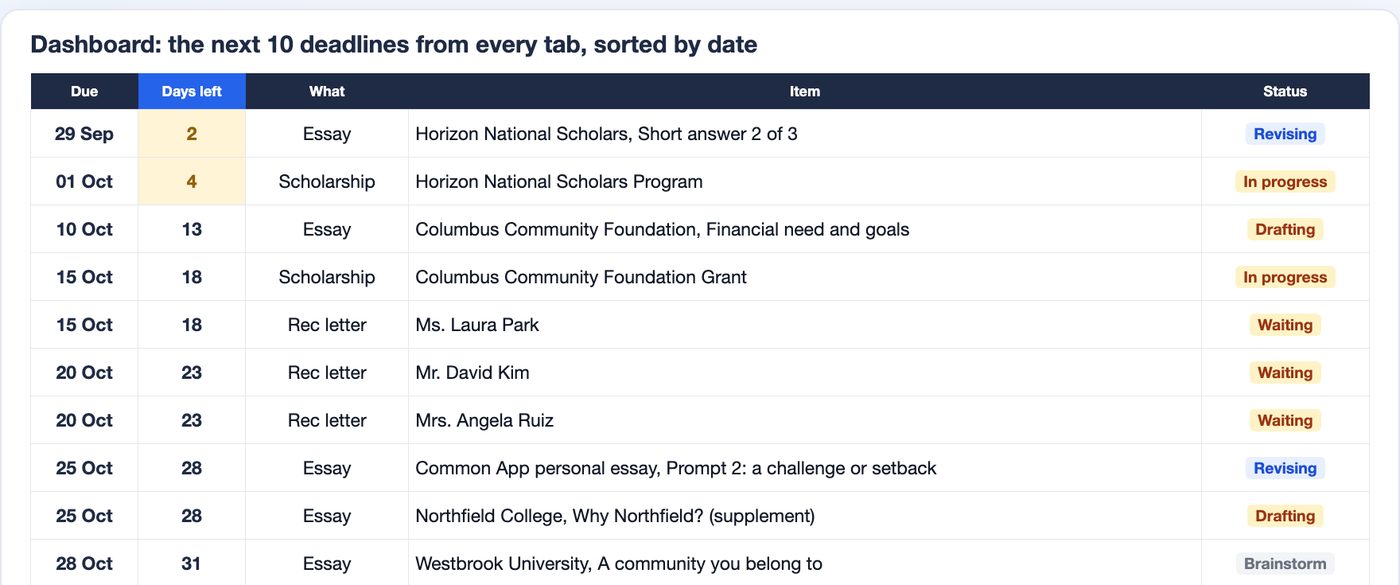
On 27 September none of the ten items is an application. The list is a short answer due in 2 days, a 20,000 scholarship due in 4, an essay for a community grant, the grant itself, three recommendation letters between 15 and 20 October, and three college essays due on 25 and 28 October. That is the point of pulling the tabs together: the 1 November deadline is 35 days out, but the work that makes it possible is due in the next four weeks, and most of it does not live on the Applications tab.
The Essays tab shows how close each piece is. The Common App personal essay is at 612 of 650 words, draft 3, with the counselor reading it. The Northfield supplement is at 180 of 300, the Columbus grant essay at 320 of 500. Three essays are still at Brainstorm with no words, including the two for the January schools. Words left is a one-cell subtraction that turns red below zero:
=IF(D6="","",D6-IF(E6="",0,E6))
The Recommenders tab has the same shape: four people asked in early September, one letter already in from the robotics coach, three teachers and counselors due by 15 and 20 October, all showing Waiting.
Scholarships: 2,750 won, 71,000 still open
Nineteen scholarships are on the list, from a 500 library essay contest to a 20,000 renewable national program, 83,250 in total. Seven have been decided or sent: three won for 2,750, one not awarded, three submitted and waiting. Those seven add up to 12,250 applied for. The other twelve are open, worth 71,000, and that is the orange tile.
| Status | Scholarships | Amount | Where it shows |
|---|---|---|---|
| Won | 3 | 2,750 | Scholarships won tile |
| Submitted, waiting | 3 | 9,000 | Counted in Applied for |
| Not awarded | 1 | 500 | Counted in Applied for |
| Applied for | 7 | 12,250 | Applied for tile |
| In progress | 6 | 60,000 | On the deadline list |
| Researching | 6 | 11,000 | On the deadline list |
| Still to apply for | 12 | 71,000 | Still to apply for tile |
The 71,000 is heavy with college-run money: a 12,000 presidential scholarship at Lakeshore, 15,000 merit at Northfield and 10,000 from Hawthorne's scholars weekend, all tied to applying early. With the 20,000 Horizon program due on 1 October, four rows carry 57,000 of the 71,000. The tile is one SUMIFS over a helper column that marks open rows with a 1:
=SUMIFS(Scholarships!$D$6:$D$1005, Scholarships!$M$6:$M$1005, 1)
What each college really costs after aid
The tab that is different from a deadline list is Aid Compare. For each college you type the cost per year (tuition and fees, housing and food, books and travel) and the aid offer, now from the net price calculator on each college's site and in spring from the award letter. The sheet separates free money from loans and ranks the colleges cheapest first.
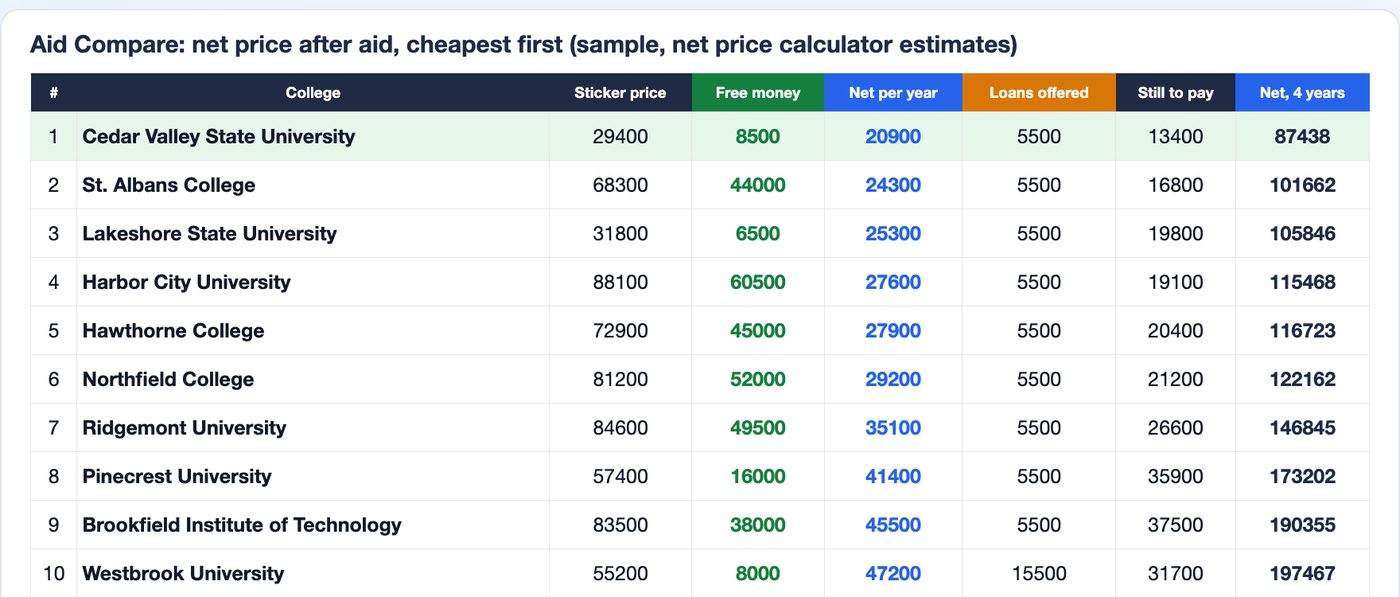
The sticker prices run from 29,400 at Cedar Valley State to 88,100 at Harbor City. The net prices run from 20,900 to 47,200, and the order is not the same. Harbor City, the most expensive college on paper, offers 60,500 in grants and lands fourth cheapest at 27,600 a year, below two of the public universities. Westbrook, a public university at 55,200 out of state with 8,000 in grants, is the most expensive at 47,200, and the only one whose offer includes 10,000 in parent loans on top of the 5,500 federal loan. The formulas are plain subtraction:
Free money:    =H6+I6+J6
Net price:     =ROUND(G6-N6,2)
Still to pay:  =MAX(0,ROUND(G6-N6-K6-L6-M6,2))
G is the total cost, H to J the three kinds of grants, K work-study, L and M the loans. Still to pay is what the family finds in cash each year after the loans and the campus job: 13,400 at Cedar Valley, 31,700 at Westbrook. The 4-year column adds four years of net price with a 3% rise each year, a rate you can change in one cell. On that basis the gap between the cheapest and the most expensive college on Maya's list is 26,300 a year and 110,029 over four years.
These are estimates typed from calculators, and the file says so on the tab: the college's own letter is what counts. But having the estimate in September changes the conversation about which applications are worth the fee and the essay. The net price is also the number that goes into the family's annual budget next year, not the sticker price.
Keeping it current until the decisions
The tracker only works if the rows change as the work happens, and that takes a minute a day: an x when the transcript goes out, a word count after a writing session, a status change when a letter arrives. The Dashboard follows the real date, so the days left count down on their own. A student who already keeps a habit tracker can treat the essay word count the same way: the number has to move most days between now and 25 October. In spring the same file takes the decisions and the award letters, and Aid Compare turns from an estimate into the actual choice.
College Application Tracker for Google Sheets and Excel
Two files: Lite with 4 tabs (Applications, Scholarships, Dashboard) and Full with 11 tabs adding Colleges, Aid Compare, Essays, Recommenders, Visits and a Phone view. Room for 100 applications, 1,000 scholarships and 15 colleges on Aid Compare. Six-part checklist with Ready % and next step, the next 10 deadlines from every tab, net price after aid cheapest first, 7 charts. Sample data inside plus blank copies. Not affiliated with the Common App or any college.
Get the College Application Tracker on Etsy →FAQ
What should a college application tracker include?
One row per application with the plan (ED, EA, RD or Rolling), the deadline, the portal, the fee and a checklist of the parts: application form, essays, transcript, test scores, recommendations, fee. From those the sheet counts the readiness, the days left and the next step. The sample file adds colleges, scholarships, essays, recommenders, visits and a comparison of aid offers.
How is Ready % calculated?
Six parts per application, an x when a part is done and n/a when the college does not need it. Both count as done, so a test-optional college with no recommendation requirement can still reach 100%. In the sample Lakeshore State has 4 of 6 and shows 67%; the average across the 10 applications is 43%.
What counts as a deadline on the dashboard?
Applications not submitted yet, scholarships in Researching or In progress, essays that are not Final or Submitted, and recommendation letters not in. The next 10 are sorted by date with the days left, amber inside 7 days and red once passed. On 27 September the list ran from an essay due in 2 days to one due in 31 days.
How is the net price of a college counted?
Total cost per year (tuition and fees, housing and food, books and travel) minus free money (college grants and scholarships, outside scholarships, federal and state grants). Loans and work-study do not lower the price. In the sample Harbor City has an 88,100 sticker price and 27,600 net, while Westbrook is 55,200 on paper and 47,200 net.
Can a parent and a student share the tracker?
Yes. In Google Sheets share your copy and both see the same dashboard and deadline list. The student types the applications and essays, the parent can fill the Aid Compare tab from the net price calculators and later from the award letters.
More from the blog
- How to Price Handmade Products: Materials, Labor, Fees and ProfitA worked pricing example for handmade products: an 8 oz soy candle that costs 11.29 to make needs 23.99 on Etsy for a 40% margin after fees. Formulas, a price ladder from 20% to 70%, fee comparison and break-even.
- Home Bakery Pricing: Cost Per Serving, Cake Quotes and Your MarginHow a home bakery spreadsheet prices a cake by servings: 36 servings at 7.50 each, 342.38 with tax, a 50% deposit, and 173.67 of profit on a 149.33 cost, plus a bake plan built from confirmed orders.
- Side Hustle Bookkeeping: Profit and Loss in One TabHow a small business bookkeeping spreadsheet turns 35 income rows and 40 expenses into a monthly profit and loss: 12758.50 in, 4405.39 out, 8353.11 profit, a 65.5% margin and a quarterly tax set-aside.
- Subscription Tracker: What Your Subscriptions Cost Per YearWhat a subscription tracker spreadsheet shows for a list of 24 subscriptions: 310.32 a month and 3,723.87 a year once yearly, quarterly and weekly plans are normalized, 6 charges due in the next 7 days, a trial ending, and 5 unused subscriptions worth 875.63 a year.